

Ordinal data is a form of quantitative data that organizes information into ordered categories, and it’s easy to confuse with other data types at first glance. This guide breaks down the concept and walks through clear examples of ordinal data in everyday scenarios, from customer satisfaction ratings to education levels.
It also covers collection methods and analysis techniques, along with practical tips for working with this type of data — useful whether the goal is running a survey, analyzing feedback, or just making sense of ranked results.
Key Takeaways
- Ordinal data is a type of quantitative data that ranks or orders categories, but the differences between the categories may not be equal.
- Examples of ordinal data include interest level, education level, socio-economic status, and satisfaction level.
- Collecting ordinal data involves choosing the appropriate level of measurement and using tools like Likert scales.
- Analyzing ordinal data requires descriptive statistics to summarize the data and statistical tests to compare groups.
Understanding Ordinal Data

Ordinal data is a type of variable that can be ranked or ordered. Understanding its levels of measurement and characteristics is the first step to working with it correctly.
Levels of measurement
Data can be measured in four ways. One is ordinal data. The other three are nominal, interval, and ratio data. Ordinal data groups things into an order or rank, while nominal data groups things into categories with no set order.
Interval and ratio data, by contrast, have a set amount between each group.
Characteristics of ordinal data
Ordinal data is put into groups or ranks that follow an order, such as ‘first’, ‘second’, and ‘third’. Each step in the rank holds a clear place, so it’s possible to know which is more and which is less, even without knowing the exact underlying value behind each rank.
What isn’t possible is knowing exactly how much bigger or smaller one step is compared to the next, since the steps aren’t necessarily equal in size. This is the key distinction that separates ordinal data from interval or ratio data, where the gaps between values carry real meaning.
Ordinal data also shows up as a scale or list of options like “very sad,” “sad,” “okay,” “happy,” and “very happy.” Only certain kinds of math apply to this type of data, such as finding what comes up most often or what sits in the middle of all the answers given — not adding or multiplying the values together.
Comparison to other types of variables
Ordinal data is unique and different from other types of variables in several key ways. Here’s a comparison between ordinal data and nominal, interval, and ratio data.
| Type of Data | Definition | Characteristics | Examples |
|---|---|---|---|
| Ordinal Data | Quantitative data that is categorized into ordered categories or ranks. | Categories have a natural order, but differences between categories are not equal. Mathematical operations like addition or multiplication are not meaningful. | Ratings, rankings, Likert scales. |
| Nominal Data | Data that is categorized into unordered groups or categories. | Categories have no order or scale. Only mathematical operation possible is counting. | Gender, marital status, types of food. |
| Interval Data | Numeric data with consistent intervals between each point. | Differences between data points are meaningful. Addition and subtraction are possible, but multiplication and division are not. | Temperature measured in Celsius or Fahrenheit, IQ scores. |
| Ratio Data | Numeric data with a consistent interval and a true zero point. | All mathematical operations are possible. Ratio comparisons are meaningful. | Height, weight, age, income. |
As the table shows, the key difference between ordinal data and other types is the presence of a natural order in the categories, combined with the inability to perform addition or multiplication on the data. Nominal data, by comparison, has no order at all, while interval and ratio data both carry meaningful, evenly spaced values.
This unique nature of ordinal data makes it valuable in specific types of analyses and research, particularly when using a data integration platform to combine and interpret diverse data sources.
Examples of Ordinal Data

Interest level, education level, socio-economic status, satisfaction level, and comparison are some examples of ordinal data.
Interest level
Interest level is an example of ordinal data. It measures the degree of interest someone has in a particular topic or activity. For example, on a scale from 1 to 5, someone might rate their interest in technology as a 3.
In ordinal data, the categories have a natural order or rank, but the differences between them may not be equal. So while it’s possible to say that one person rates their interest higher than another’s, it isn’t possible to determine by how much more they’re interested.
This type of data is commonly collected through surveys or questionnaires and can be analyzed using descriptive statistics like frequency distribution and measures of central tendency such as median or mode, which give a sense of where most responses cluster.
Education level
Education level is an example of ordinal data. It represents the ranking or order of someone’s educational achievement, such as high school diploma, bachelor’s degree, or master’s degree.
In ordinal data like education level, there’s a clear progression from one category to another, but the differences between them aren’t necessarily equal. For example, the gap between a high school diploma and a bachelor’s degree isn’t the same as the gap between a bachelor’s degree and a master’s degree.
Understanding education level as ordinal data helps researchers analyze and interpret its impact on various outcomes, like job opportunities or income levels, accurately — treating it as if the gaps were equal would distort the analysis.
Socio-economic status
Socio-economic status, or SES, is a type of ordinal data that measures a person’s position in society based on factors like their income, education level, and occupation. It helps researchers understand how social and economic factors can impact people’s lives.
For example, someone with a high SES may have more access to opportunities and resources than someone with a low SES. Data on socio-economic status can be collected through surveys or questionnaires that ask participants about their income range, educational attainment, and job title.
Analyzing this data allows researchers to identify patterns and trends related to social inequality and inform policies aimed at reducing disparities in society, since ranked categories make it possible to compare groups without needing precise numerical measurements.
Satisfaction level
Satisfaction level is an example of ordinal data. It measures people’s satisfaction or contentment with a product, service, or experience, with the categories ranked from low to high satisfaction.
For example, in a customer survey, participants might rate their satisfaction on a scale from 1 to 5, or use words like “very dissatisfied,” “dissatisfied,” “neutral,” “satisfied,” and “very satisfied.” The key thing to remember about ordinal data is that the categories have a rank order, but the differences between them may not be equal.
Analyzing satisfaction levels involves calculating summary statistics like frequency distribution, and finding the mode (the most common level of satisfaction) or median (the middle value). These summaries make it far easier to spot whether responses skew toward the positive or negative end of the scale.
Comparison
Understanding how ordinal data compares to other data categories — specifically nominal, interval, and ratio data — matters because it shapes how the data gets gathered, analyzed, and interpreted.
| Type of Data | Definition | Examples | Key Characteristics |
|---|---|---|---|
| Ordinal | Quantitative data that is categorized in an ordered sequence. | Rankings, ratings, and Likert scales | The categories have a natural order, but the differences between the categories may not be equal. |
| Nominal | Qualitative data that is categorized without any order or priority. | Gender, hair color, and nationality | The categories can be named but not ranked or ordered. |
| Interval | Quantitative data with continuous values where the difference between values is meaningful. | Temperature in degrees Celsius, IQ scores, and SAT scores | The intervals between the categories are equal, but there is no true zero point. |
| Ratio | Quantitative data with continuous values where both the difference between values and the ratio of values are meaningful. | Age, height, weight, and income | There is a true zero point, and both subtraction and division are meaningful. |
Understanding these differences makes it easier to choose the right data type for a specific research purpose, and to avoid applying statistical methods that assume a level of precision the data doesn’t actually have.
Collecting Ordinal Data

Collecting ordinal data starts with choosing the right level of measurement, then using tools such as Likert scales to gather information on ranked categories.
Choosing the level of measurement
Ordinal data is a type of quantitative data that falls under one of the four levels of measurement. Selecting the right level of measurement for a dataset means considering the nature of the variables involved.
Ordinal data fits when the categories can be ranked in a particular order, such as rankings or ratings. This is different from nominal data, where categories are simply labeled without any inherent order.
Choosing ordinal measurement captures the natural rank order and clarifies relationships between categories based on their position in the scale, which makes analysis and interpretation of research findings easier later on, since the structure of the data is set correctly from the start.
Using Likert scales
Likert scales are a popular method for collecting ordinal data. Here are some key points to know about using them:
- Likert scales involve presenting respondents with a statement or question and asking them to indicate their level of agreement or disagreement.
- The response options typically range from strongly agree to strongly disagree, with a neutral option in the middle.
- Each response option is assigned a numerical value, allowing for quantitative analysis of the data.
- Likert scales can be used in surveys, questionnaires, or any research instrument where opinions or attitudes need to be measured.
- They are commonly used in areas such as customer satisfaction surveys, employee feedback surveys, and market research studies.
- When using Likert scales, it’s important to ensure clear and concise wording of the statements or questions.
- The number of response options should also be carefully considered. Too many options can lead to respondent confusion, while too few options may not capture the full range of opinions.
- Data collected using Likert scales can be analyzed using various descriptive statistics such as mean, median, and mode.
- Statistical tests like the chi-square test and Mann–Whitney U test can also be applied when comparing groups based on their responses.
Analyzing Ordinal Data
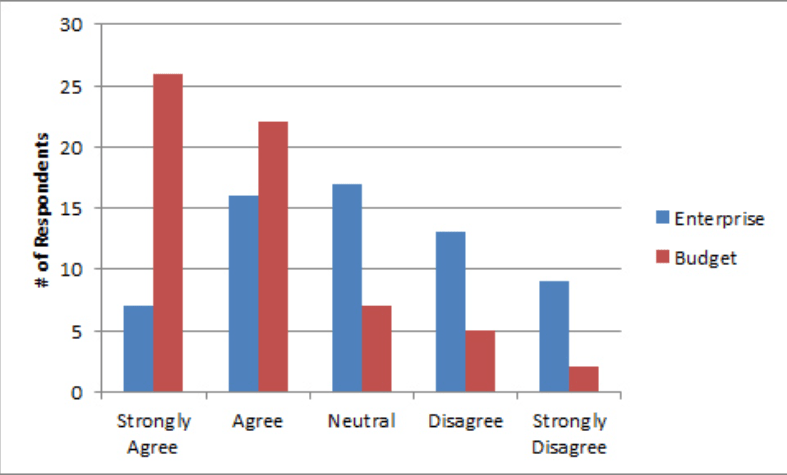
Analyzing ordinal data involves using descriptive statistics to summarize the data, such as measures of central tendency and variability, along with statistical tests to determine whether there are significant differences between groups.
Descriptive statistics
Descriptive statistics is an important part of analyzing ordinal data. It helps clarify the characteristics and patterns in the data. With descriptive statistics, it’s possible to calculate summary measures such as frequency distribution, median, and mode.
These measures give a clear picture of how the categories are distributed and which values are most common. For example, with ordinal data on customer satisfaction levels, descriptive statistics can reveal the most frequent level of satisfaction and the overall pattern of responses, which is often more useful than a single average figure.
Visualization techniques like bar charts or stacked bar charts can also help represent this information in a format that’s easy to understand, making it faster to spot trends or differences between categories.
While descriptive statistics provide valuable insight into ordinal data, it’s worth remembering that mathematical operations like addition or multiplication aren’t meaningful with this type of data.
Measures of central tendency
Ordinal data provides some important measures of central tendency that help with data interpretation. These include the mode, the median, and sometimes the mean. The mean, however, is often not a trustworthy measure for ordinal data because of the inherent inequality between the categories.
| Measure | Description | Application to Ordinal Data |
|---|---|---|
| Mode | Most frequently occurring value in the data set | Can be used with ordinal data to identify the most commonly occurring category or rank |
| Median | Middle value in a sorted data set | Can be used with ordinal data to find the middle ranking or category, assuming the data has a clear order |
| Mean | Arithmetic average of the data set | Less frequently used with ordinal data due to the unequal distances between categories. However, may still provide a rough estimate of the central tendency if required |
These are key statistics for ordinal data analysis. They summarize complex or large volumes of data into a single value, and since ordinal data often involves rankings or ratings, these measures help identify common trends or patterns in the responses.
Variability
Variability is an important aspect of analyzing ordinal data. It refers to the amount of dispersion or spread within the ranked categories — in other words, how much the values in a dataset differ from each other.
While descriptive statistics like frequency distribution and measures of central tendency (such as median and mode) describe the average or typical value, variability shows the range or diversity of values.
Understanding variability in ordinal data gives a fuller picture of the patterns and differences within a dataset, supporting more informed decisions based on the findings — two datasets can share the same median while looking very different once variability is taken into account.
Statistical tests
Statistical tests are used to analyze ordinal data and draw conclusions from the results. Here’s what’s important to know about statistical tests for ordinal data:
| Statistical Test | Description |
|---|---|
| Non-parametric tests | Due to the characteristics of ordinal data, non-parametric tests are often used. These tests do not assume a specific distribution of the data. |
| Mann-Whitney U test | This test compares two groups and determines if there is a significant difference between them based on their ranks. |
| Kruskal-Wallis test | This test is used when comparing more than two groups to see if there is a significant difference in their rankings. |
| Wilcoxon signed-rank test | This test is used when comparing related samples, such as before and after measurements, to determine if there is a significant difference in their ranks. |
| Chi-square test for independence | This test assesses whether there is a relationship between two categorical variables measured on an ordinal scale. |
| Spearman’s rank correlation coefficient | This statistical measure determines the strength and direction of the relationship between two ordinal variables. |
Limitations and Applications of Ordinal Data
Ordinal data has its limitations, primarily because it lacks precise measurements and fixed intervals. Even so, it finds extensive use in surveys, research studies, customer service evaluations, and job applications, wherever subjective ranking or ordering is necessary for analysis and decision-making. The trade-off is worth it in situations where a precise numeric measurement simply isn’t available or practical to collect.
QuestionPro’s advanced survey software can help manage ordinal data collection and analysis while providing valuable insight into respondents’ preferences and opinions.
Uses in surveys, research, customer service, and job applications
Ordinal data is widely used in surveys, research, customer service, and job applications. It provides valuable insight into people’s preferences, opinions, and rankings. Here are some specific ways ordinal data gets used in these areas:
| Use | Description |
|---|---|
| Surveys | Ordinal data allows researchers to gather information on customer satisfaction levels, product preferences, and opinions on various topics. This data helps businesses make informed decisions and improve their offerings. |
| Research | In academic studies or scientific research, ordinal data enables researchers to measure attitudes, behavior patterns, and performance rankings. This data is essential for drawing conclusions and making comparisons between different groups. |
| Customer Service | Many customer satisfaction surveys utilize ordinal scales to gather feedback on the quality of products or services provided. Companies can use this information to identify areas for improvement and enhance customer experiences. |
| Job Applications | Ordinal data is often used in job applications to assess candidates’ qualifications relative to each other. For example, a questionnaire may ask applicants to rank their proficiency levels in specific skills or rate their comfort level with certain tasks. |
How QuestionPro can help with managing ordinal data
QuestionPro is a survey platform that can assist in managing and analyzing ordinal data. It offers features like Likert scale questions, which are commonly used to collect ordinal data.
With QuestionPro, it’s straightforward to design surveys and questionnaires with ranked response options to gather the necessary information. It also offers data analysis tools that generate descriptive statistics for ordinal data, such as frequency distribution, median, and mode.
This helps clarify the distribution and central tendency of the data. QuestionPro also supports visualizing ordinal data through bar charts or stacked bar charts for easier interpretation.
Tips for gaining insights with ordinal data
| Tip | Description |
|---|---|
| Use Appropriate Statistical Tests | When analyzing ordinal data, it’s important to use statistical tests that are suitable for ranked categories. Tests like the Mann-Whitney U test or Spearman’s rank correlation can provide valuable insights. |
| Avoid Treating Ordinal Data as Continuous | Remember that ordinal data does not have equal intervals between categories. Avoid making assumptions about the magnitude of differences between the categories and refrain from using mathematical operations like addition or multiplication. |
| Visualize the Data Effectively | Use bar charts or stacked bar charts to visually represent ordinal data. This can help in understanding patterns, comparisons, and trends within the ranked categories. |
| Take into Account Context and Meaning | Consider the context of the ordinal data and its implications. Understand how each category relates to the research question or objective, and interpret the results accordingly. |
| Consider Combining with Other Types of Data | Sometimes, combining ordinal data with other types of variables, such as nominal or ratio variables, can provide a more comprehensive analysis and deeper insights. |
Following these tips when working with ordinal data helps surface meaningful insights and supports better-informed decisions based on the analysis.
Conclusion
Understanding ordinal data matters for collecting and analyzing information in a meaningful way. Ordinal data is a type of quantitative data organized into ordered categories or ranks.
It differs from nominal and interval/ratio data because the categories have a natural order or scale, but the differences between them may not be equal. Examples of ordinal data include rankings, ratings, and Likert scales.
While mathematical operations like addition or multiplication aren’t meaningful with ordinal data, it still provides valuable insight and can be used in statistical analyses and modeling.
Frequently Asked Questions
What is ordinal data?
Ordinal data is a type of categorical data that represents information with a specific order or ranking, such as rating scales or survey responses with options like low, medium, and high.
What are some examples of ordinal data?
Examples of ordinal data include rankings in sports competitions, educational grades (A, B, C), customer satisfaction ratings (very satisfied, satisfied, dissatisfied), or levels of agreement/disagreement (strongly agree, agree, neutral, disagree).
How is ordinal data collected?
Ordinal data can be collected through surveys or questionnaires where respondents provide their rank-order preferences or opinions by selecting from a predefined set of options.
Can I analyze ordinal data using statistical methods?
Yes! Ordinal data can be analyzed using various statistical methods like the Mann-Whitney U test or Spearman’s rank correlation coefficient to examine relationships or differences between variables.
Is it possible to convert ordinal data into numerical values for analysis?
While it may be tempting to assign numerical values (e.g., 1 for low and 5 for high) to represent ranks in ordinal data during analysis, caution should be exercised as these numbers do not reflect equal distances between categories and may mislead interpretation.
Related Articles
Buyers guide
Twilio Alternatives 2026: 6 Compared and What They Cost
Continue reading →

Finance & Billing Software
Best Payroll Software for Contractors and Freelancers in 2026
Continue reading →

Buyers guide
How To Choose The Best Auto Dialer Software For 2026
Continue reading →

Buyers guide
How To Choose The Best Freelance Platforms For 2026
Continue reading →