
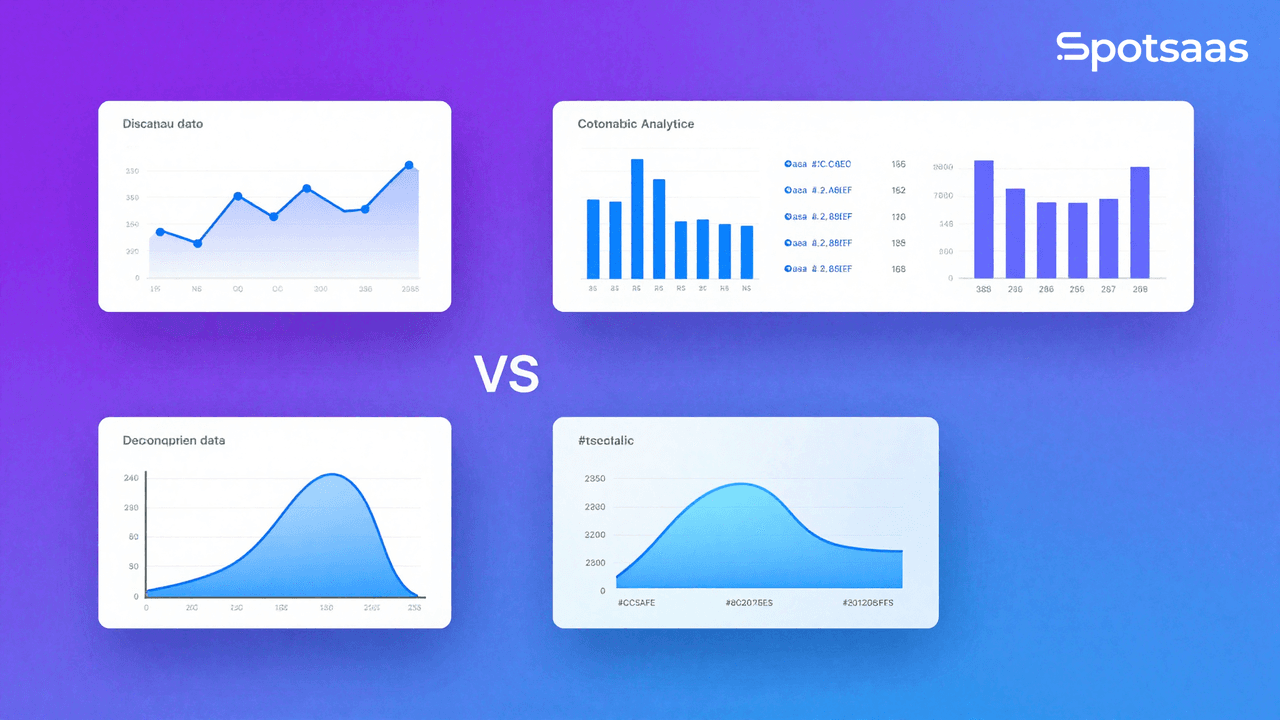
Data drives analytics, decision-making, and automation across industries. It comes in several forms, with continuous and discrete data standing out as two fundamental types. Understanding the difference matters for data analysis, AI, and machine learning.
This guide walks through their differences, real-world applications, and emerging trends in technology, business, and science.
The distinction sounds simple on paper, but it shapes real decisions: which chart type to use, which statistical test applies, and even which machine learning model fits a given dataset. Getting it wrong early in a project can mean redoing analysis later.
Key Takeaways
- Continuous data is measured and can take any value within a range, while discrete data is countable with distinct values.
- Continuous data powers real-time monitoring and AI-driven decision-making.
- Discrete data supports event tracking, business analytics, and classification models.
- AI, IoT, and blockchain are driving the need for efficient data processing.
- Hybrid models that integrate both data types enhance analytics, automation, and decision-making across industries.
What is Continuous Data?
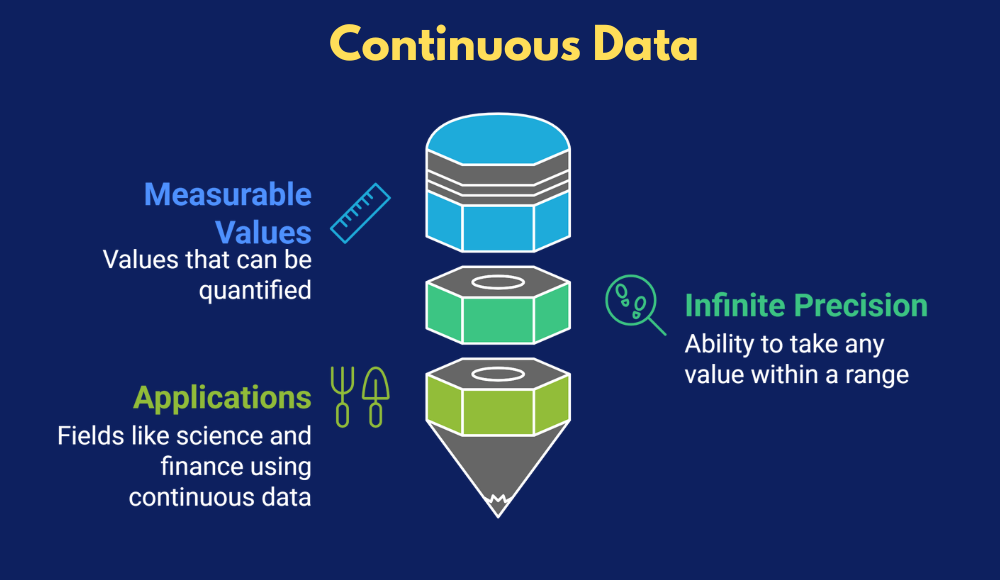
Continuous data consists of measurable values that can take any number within a range, including decimals or fractions. Unlike discrete data, which is limited to fixed values, continuous data allows for infinite precision.
It’s commonly used for variables that change smoothly over time, such as temperature, speed, or body measurements, which makes it essential in fields like science, engineering, healthcare, and finance.
Because continuous values can, in theory, be measured to any level of precision, the exact figure recorded often depends on the instrument doing the measuring rather than any natural stopping point in the data itself.
Characteristics of Continuous Data
- Can take any value within a given range.
- Measured rather than counted.
- Includes decimals and fractions for greater accuracy.
- Often represented by line graphs, histograms, and probability distributions.
Examples of Continuous Data Across Different Fields
This table shows examples of continuous data and how they’re measured across various fields.
| Category | Example | How It’s Measured |
|---|---|---|
| Physical Measurements | Height and weight of a person | Measured in centimeters, kilograms, pounds |
| Temperature readings | Measured in Celsius, Fahrenheit, Kelvin | |
| Speed of a moving vehicle | Measured in kilometers per hour (km/h), mph | |
| Time and Finance | Time duration (work hours, exercise time) | Measured in hours, minutes, seconds |
| Stock market prices | Measured in currency values with decimals | |
| Inflation rate | Measured as a percentage over time | |
| Science and Medicine | Heart rate variability | Measured in beats per minute (bpm) |
| Blood pressure | Measured in mmHg (millimeters of mercury) | |
| Oxygen saturation levels | Measured in percentage (%) | |
| Engineering and Technology | Sound levels | Measured in decibels (dB) |
| Machine temperature | Measured in degrees (°C, °F) | |
| Battery charge level in devices | Measured in percentage (%) | |
| Environmental Data | Rainfall measurements | Measured in millimeters (mm) |
| Wind speed | Measured in kilometers per hour (km/h) | |
| River water levels | Measured in meters (m) |
Latest Trends in Continuous Data
Continuous data is playing an increasing role in emerging technologies, helping industries make real-time decisions and automate processes.
AI and Machine Learning for Predictive Analytics
Machine learning models depend on continuous data to detect trends, predict future events, and automate decision-making. AI algorithms analyze large volumes of real-time continuous data to produce accurate predictions.
- AI-powered health monitoring systems analyze heart rate variability, oxygen levels, and blood pressure readings to catch early signs of medical conditions.
- Stock market prediction models use historical price movements, trading volume, and real-time financial data to forecast future trends.
- AI-based weather forecasting systems analyze temperature, humidity, and wind speed to produce accurate climate predictions.
IoT and Real-Time Data Streaming
Continuous data is widely used in Internet of Things (IoT) devices, letting smart technology function efficiently. These devices collect, process, and transmit data in real time to power automation and control systems.
- Smartwatches and fitness trackers continuously monitor step count, heart rate, and calories burned to provide health insights.
- Self-driving cars analyze continuous data from sensors, including speed, acceleration, road conditions, and pedestrian movements, to make real-time driving decisions.
- Industrial automation systems track machine temperature, pressure levels, and vibration patterns to catch malfunctions and prevent failures.
Edge Computing for Faster Data Processing
Continuous data used to be sent to cloud-based servers for processing. Edge computing now allows that data to be processed locally on devices instead, cutting latency and improving response times.
- Security surveillance cameras use edge computing to analyze live video streams and identify security threats in real time.
- Healthcare wearable devices process heart rate and temperature data on-device, allowing instant alerts on abnormalities.
- Manufacturing systems analyze sensor data locally, catching defects without sending large amounts of data to centralized cloud storage.
What is Discrete Data?
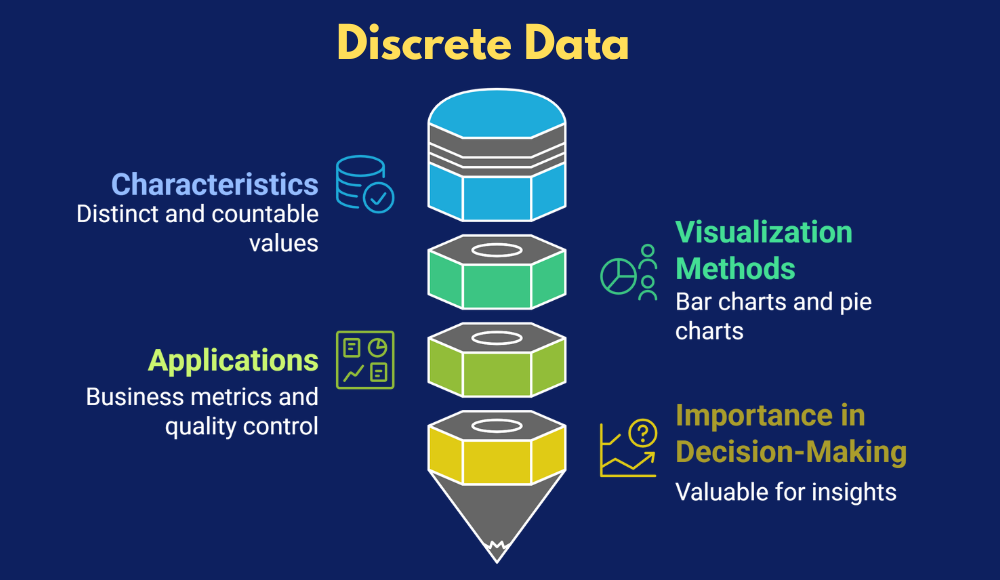
Discrete data consists of distinct, countable values that can’t be divided into smaller parts. It represents whole numbers, such as employee count, defective products, or survey responses.
Unlike continuous data, discrete data is finite and is often visualized using bar charts, pie charts, or frequency tables. It helps with statistical analysis, making it valuable for business metrics, quality control, and customer insights, and it’s widely used in decision-making across industries.
Because discrete values jump from one whole number to the next with nothing in between, they tend to be easier to summarize in a simple count or a straightforward chart than continuous measurements are.
Characteristics of Discrete Data
- Consists of separate, distinct values.
- Always counted, not measured.
- Cannot take decimal or fractional values.
- Typically represented using bar charts or pie charts.
Examples of Discrete Data Across Different Fields
This table highlights examples of discrete data and how they’re measured across various domains.
| Category | Example | How It’s Measured |
|---|---|---|
| Business & Finance | Number of employees in a company | Counted as whole numbers |
| Sales transactions per day | Counted as individual purchases | |
| Education | Number of students in a class | Counted as whole numbers |
| Exam scores (out of 100) | Counted as discrete points | |
| Healthcare | Number of patients in a hospital | Counted as whole numbers |
| Number of doctor visits per year | Counted as individual visits | |
| Technology | Number of devices connected to a network | Counted as individual connections |
| Software bugs reported in a month | Counted as distinct issues | |
| Sports & Entertainment | Goals scored in a match | Counted as whole numbers |
| Number of tickets sold | Counted as individual sales | |
| Manufacturing | Defective products in a batch | Counted as separate units |
| Number of items produced | Counted as whole numbers |
Latest Trends in Discrete Data
Discrete data is a key input for decision-making in business intelligence, predictive modeling, and automation.
As technology advances, industries are leaning on discrete data for analytics, forecasting, and optimization. It helps organizations track specific events, measure key performance indicators, and make data-driven decisions more efficiently.
AI and Data Analytics for Trend Detection
Machine learning models use discrete data to spot patterns and trends across industries:
- Retail businesses analyze the number of daily transactions to optimize inventory and marketing strategies, keeping supply in line with customer demand.
- Educational platforms track quiz scores and student attendance to personalize learning experiences, improving engagement and retention.
- Social media platforms analyze discrete engagement metrics, such as likes, shares, and comments, to improve content recommendations and increase user interaction and time spent on the platform.
By leveraging discrete data, businesses can fine-tune operations, improve user experiences, and build more targeted strategies. To handle more complex, dynamic scenarios, organizations can also implement multi agent AI, where multiple AI agents interact and collaborate to optimize outcomes across systems and processes.
IoT and Smart Data Collection
With the rise of the Internet of Things (IoT), discrete data collection is becoming increasingly automated:
- Smart home systems track how many times a door is opened to strengthen security, giving homeowners insight into activity patterns.
- Industrial sensors count machine cycles to schedule predictive maintenance, reducing downtime and extending equipment lifespan.
- Transportation systems monitor vehicle counts at toll booths for traffic management, helping city planners optimize road usage and reduce congestion.
These applications enable real-time monitoring, automated responses, and better resource allocation based on precise event tracking.
Automation and AI Decision-Making
AI-driven automation relies on discrete data to improve efficiency:
- Chatbots analyze the number of customer queries to adjust response models, delivering faster and more accurate support.
- Logistics companies track package counts to streamline deliveries, optimizing routes and improving last-mile efficiency.
- Manufacturing plants optimize production schedules based on completed unit counts, reducing waste and maximizing productivity.
By integrating discrete data into AI-driven workflows, companies can sharpen decision-making, improve customer satisfaction, and boost overall operational performance.
Discrete vs. Continuous Data Key Differences
Discrete data consists of countable, distinct values, while continuous data includes measurable values within a range. Knowing the difference sharpens both data analysis and decision-making.
The table below lays out the key differences between discrete and continuous data, along with their characteristics and applications.
| Feature | Discrete Data | Continuous Data |
|---|---|---|
| Nature | Countable, distinct values | Measurable, can take any value |
| Includes | Whole numbers only | Can include decimals & fractions |
| Examples | Number of students, product defects, sales transactions | Temperature, weight, speed, stock prices |
| Visualization | Bar charts, pie charts, frequency tables | Line graphs, histograms, probability distributions |
Real-World Applications of Continuous and Discrete Data
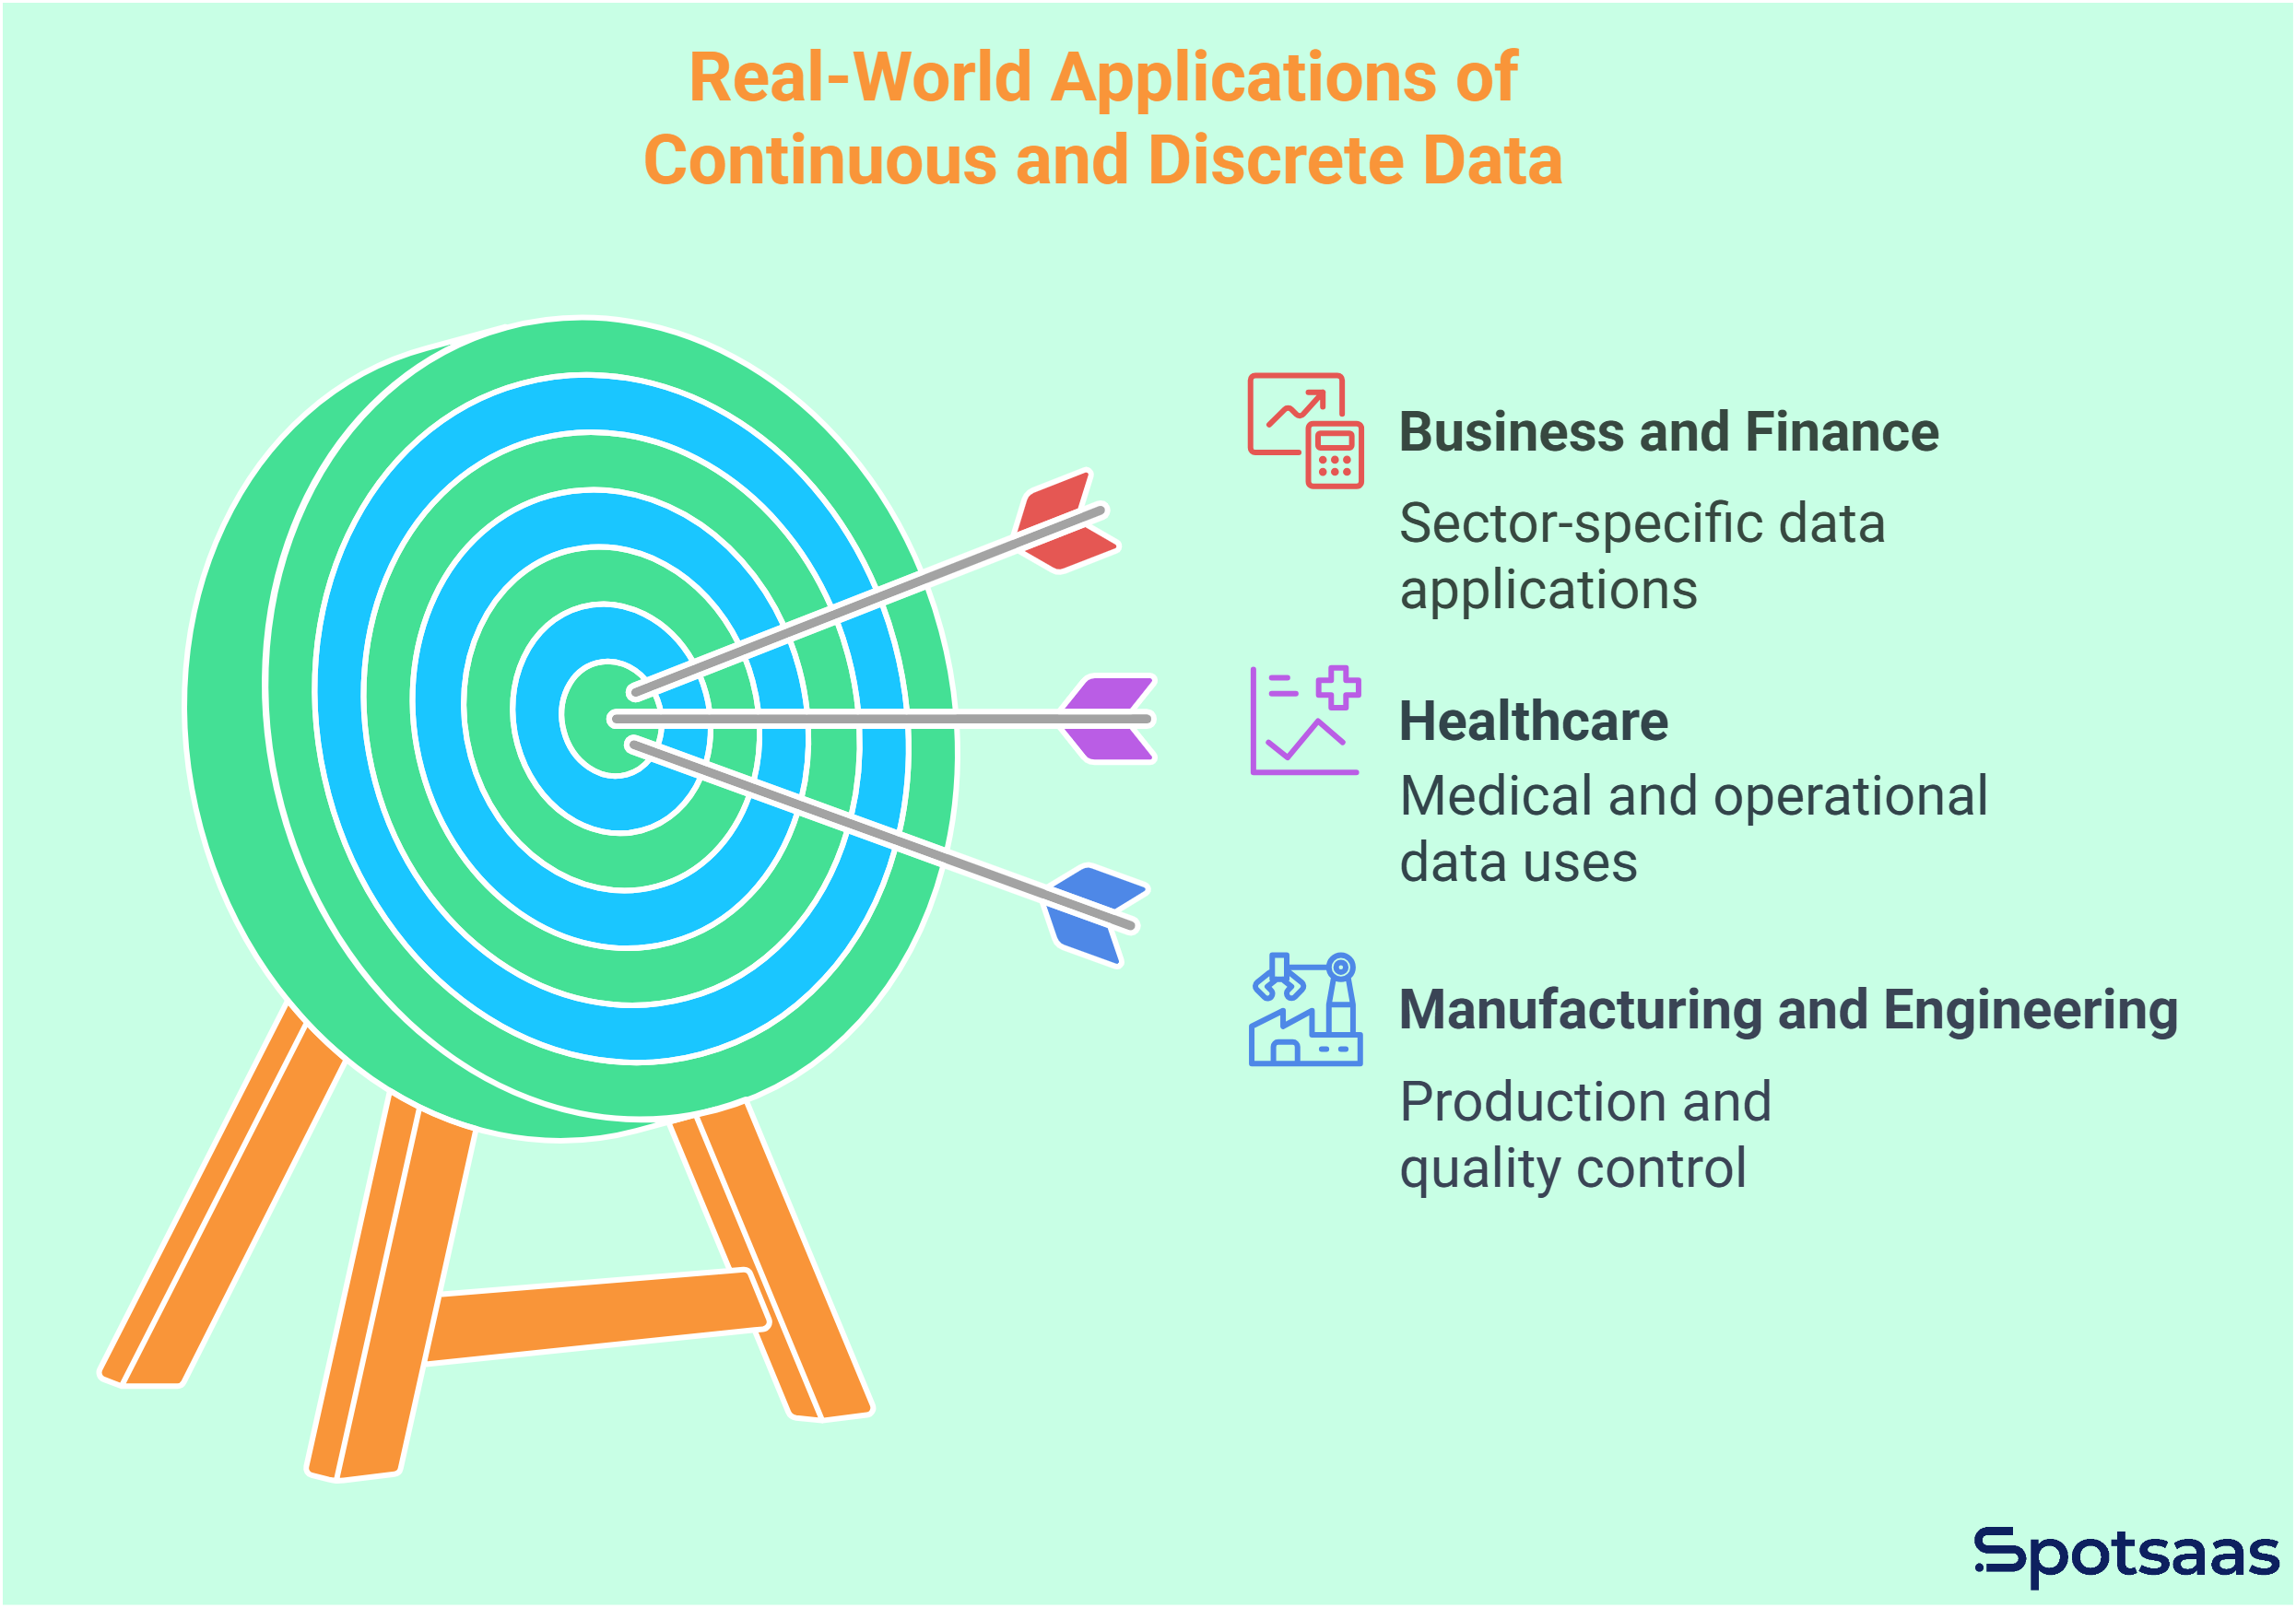
Continuous and discrete data both play a crucial role across industries, helping businesses, healthcare providers, and manufacturers make data-driven decisions. Below are key applications of both data types across different sectors.
Business and Finance
Continuous Data in Business and Finance
Continuous data is essential for tracking financial trends and making informed business decisions.
- Stock prices fluctuate throughout the trading day, requiring real-time monitoring for trend analysis and investment decisions.
- Revenue trends help businesses forecast earnings, optimize pricing, and assess financial stability.
Discrete Data in Business and Finance
Discrete data lets businesses measure specific events and track key performance indicators.
- Number of customer transactions helps analyze sales trends, customer behavior, and seasonal demand.
- Product purchases provide insight into consumer preferences and inventory management.
Healthcare
Continuous Data in Healthcare
Continuous data is vital for patient monitoring and medical research, supporting real-time analysis and early detection.
- Blood pressure levels are monitored continuously in hypertensive patients to adjust medications and prevent complications.
- Heart rate monitoring helps diagnose arrhythmias and assess cardiovascular health.
Discrete Data in Healthcare
Discrete data is used for hospital operations, patient statistics, and healthcare trend analysis.
- Number of patients admitted helps hospitals allocate resources, plan staffing, and manage patient care efficiently.
- Count of medicines prescribed lets healthcare providers monitor medication usage and spot treatment trends.
Manufacturing and Engineering
Continuous Data in Manufacturing and Engineering
Continuous data helps maintain quality control and optimize production efficiency.
- Machine speed is tracked to prevent mechanical failures and keep operations running smoothly.
- Product dimensions are measured continuously to catch defects and maintain quality standards.
Discrete Data in Manufacturing and Engineering
Discrete data is used to measure production efficiency and improve quality assurance.
- Number of defective items in a batch helps identify manufacturing issues and guide corrective actions.
- Total units produced lets manufacturers track productivity, manage supply chains, and forecast production needs.
By combining continuous and discrete data, industries can sharpen decision-making, improve efficiency, and optimize operational processes.
Notice how the two types often show up side by side in the same sector: a hospital tracks continuous blood pressure readings for one patient while also counting discrete patient admissions across the whole facility. Neither view replaces the other; they answer different questions.
How to Analyze Continuous vs Discrete Data
Analyzing continuous and discrete data calls for different collection methods, statistical approaches, and ways of handling potential challenges. Proper analysis supports accuracy in decision-making, trend forecasting, and data-driven insights across industries.
Data Collection Methods
Continuous data collection
Continuous data is measured rather than counted, typically collected using instruments, sensors, and automated systems that provide high-precision readings.
- Sensors monitor environmental conditions such as temperature, humidity, and pressure in real time.
- Meters measure continuous variables like electricity usage, fuel consumption, and vehicle speed.
- Digital logs track continuous metrics such as stock price movements, heart rate fluctuations, and climate patterns.
- Time-series recordings capture continuous changes in variables over time, such as monitoring machine performance or rainfall accumulation.
Continuous data collection is essential in industries that require real-time decision-making, predictive modeling, and monitoring of dynamic conditions.
Discrete data collection
Discrete data is countable and gets collected through event tracking, surveys, and manual recording methods.
- Surveys gather numerical and categorical discrete data, such as customer feedback, product ratings, and demographic information.
- Event logs record user actions, such as website visits, app downloads, and transactions.
- Tally counts track fixed values such as the number of units sold, defective products in manufacturing, or attendees at an event.
- Checklists are used in audits and inspections to track compliance, inventory levels, and production cycle counts.
Discrete data collection is widely used in business intelligence, statistical reporting, and decision-making that involves categorization and counting.
Statistical Techniques
Continuous data analysis
Continuous data analysis relies on statistical methods that measure trends, relationships, and variation.
- Regression models predict future values based on observed trends, such as estimating sales growth based on historical revenue.
- Standard deviation measures the spread of data points, helping with risk assessment and quality control.
- Probability distributions, such as normal, exponential, and uniform distributions, describe the likelihood of different continuous values occurring, which is useful in financial modeling and machine learning.
- Moving averages smooth out short-term fluctuations to reveal long-term trends in time-series data.
Continuous data analysis matters most in industries where precision, forecasting, and optimization play a central role.
Discrete data analysis
Discrete data gets analyzed using methods that count occurrences, classify categories, and calculate probabilities.
- Frequency distribution shows how often different discrete values appear, such as customer orders per day or defect rates in production.
- Classification models in machine learning sort data into distinct groups, such as fraud detection in banking transactions.
- Probability analysis estimates the likelihood of events, such as predicting the number of customer visits on a weekend.
- Chi-square tests help determine relationships between categorical variables, such as analyzing customer preferences based on age groups.
Discrete data analysis shows up commonly in business analytics, market research, and risk assessment.
Future Trends in Continuous and Discrete Data
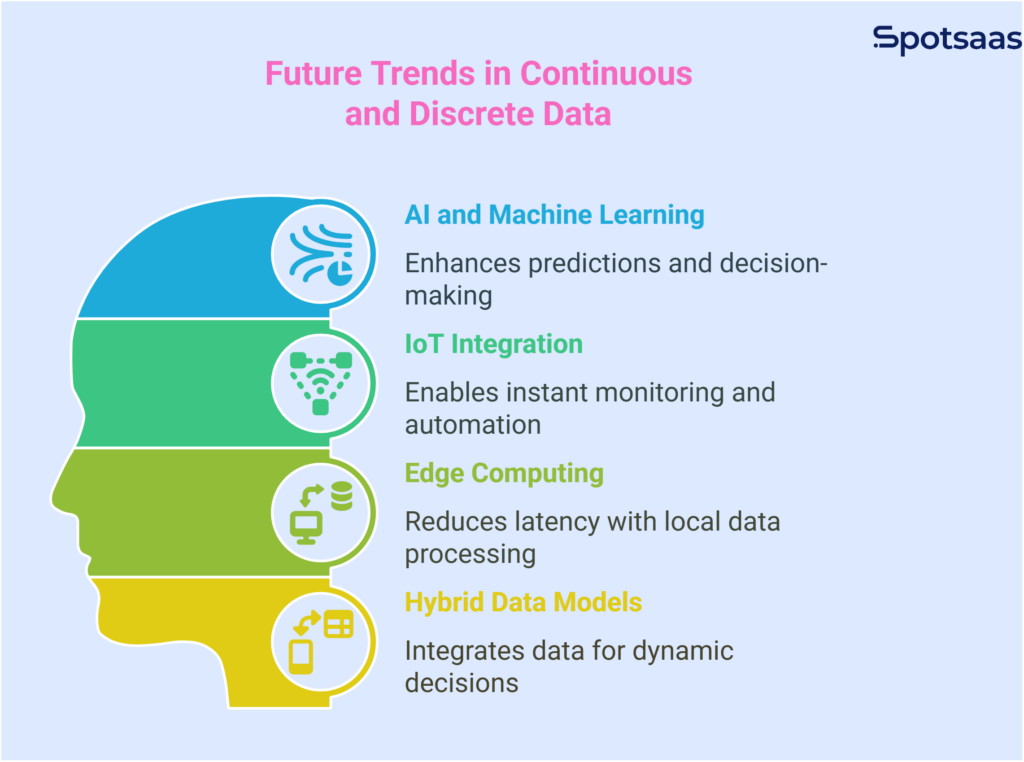
Technology is reshaping how continuous and discrete data are collected, analyzed, and applied. Businesses in healthcare, finance, and manufacturing are leaning on AI, IoT, and edge computing to improve efficiency, decision-making, and automation.
AI and Machine Learning for Data Analysis
AI uses continuous data for real-time forecasting in finance, healthcare, and automation, while discrete data strengthens classification, fraud detection, and recommendations.
Integrating both leads to more accurate predictions and smarter decision-making across industries. As AI advances, the ability to process and combine these data types will keep enhancing automation, efficiency, and adaptive learning across applications.
Real-Time Data Processing and IoT Integration
IoT enables instant monitoring and automation, sharpening decision-making. Continuous data optimizes smart homes, self-driving cars, and manufacturing, while discrete data powers event-driven analytics in website tracking, cybersecurity, and supply chain management.
As IoT adoption grows, real-time data processing will only become more central to efficiency and automation.
Edge Computing and Decentralized Processing
Edge computing reduces latency by processing data locally. Continuous data improves IoT efficiency in industrial monitoring, healthcare wearables, and autonomous systems.
Discrete data strengthens security in blockchain transactions, identity verification, and smart contract automation. As decentralized computing grows, businesses are leaning on local processing to cut reliance on centralized cloud systems.
Hybrid Data Models for Analytics
Combining continuous and discrete data improves decision-making. Retailers use both for personalized marketing, healthcare AI sharpens diagnostics, and financial firms refine investment strategies, driving automation and accuracy across industries.
Bringing these data types together lets businesses make more dynamic, data-driven decisions in real time.
Conclusion
Understanding continuous and discrete data is key to effective analysis, AI, and decision-making. Continuous data supports real-time monitoring and forecasting, while discrete data supports event tracking and classification.
As AI, IoT, and blockchain evolve, combining both data types strengthens analytics, automation, and business intelligence, enabling smarter, data-driven decisions.
Hybrid data models are reshaping industries, improving efficiency, and strengthening predictive capabilities for better strategic planning. Businesses that make good use of both data types gain a real edge in an increasingly digital world.
The practical takeaway is straightforward: before building a dashboard, running a statistical test, or training a model, take a moment to identify whether the data in front of you is measured or counted. That one basic distinction determines which tools and techniques will actually work well.
Frequently Asked Questions
What is the difference between continuous and discrete data?
Continuous data is measurable and can take any value within a range, while discrete data consists of countable, distinct values with no intermediate points.
How is continuous data used in AI and machine learning?
Continuous data powers real-time forecasting, predictive analytics, and automation in areas like finance, healthcare, and industrial operations.
Why is discrete data important in analytics?
Discrete data helps in classification, event tracking, and business analytics, supporting AI-driven recommendations, fraud detection, and structured decision-making.
Can continuous and discrete data be used together?
Yes, hybrid models combine both data types to improve predictions and decision-making, such as in airline pricing systems or personalized marketing.
How is IoT transforming continuous and discrete data usage?
IoT devices collect continuous data for real-time monitoring (e.g., temperature sensors) and discrete data for event-based tracking (e.g., counting login attempts).
Related Articles
Buyers guide
Twilio Alternatives 2026: 6 Compared and What They Cost
Continue reading →

Finance & Billing Software
Best Payroll Software for Contractors and Freelancers in 2026
Continue reading →

Buyers guide
How To Choose The Best Auto Dialer Software For 2026
Continue reading →

Buyers guide
How To Choose The Best Freelance Platforms For 2026
Continue reading →