
Tableau vs Whatagraph Comparison

Tableau
Starting at $15 /user/month
- Free Trial
- Large Enterprises
- Medium Business
Tableau, from Salesforce, is a leading business intelligence and analytics platform designed to help organizations of all sizes understand and act on their data with confidence. Built for analysts, business leaders, IT t…

Whatagraph
Starting at $119 /Month
- Free Trial
- Large Enterprises
- Medium Business
Whatagraph is a dashboard solution that seamlessly syncs to an unlimited number of Google Accounts. Share, customize and work with team, any team or even multiple teams in real-time with Whatagraph. Collaborative editing…
Tableau leads on user satisfaction with a 4.4-star rating across 3,094 reviews.
Tableau vs Whatagraph — at a glance
| Feature | Tableau | Whatagraph |
|---|---|---|
| Rating | 4.4 / 5 | 4.3 / 5 |
| Reviews | 3,094 | 203 |
| Starting price | $15 /user/month | $119 /Month |
| Free trial | Yes | Yes |
| Free version | No | No |
| Best for | Large Enterprises, Medium Business, Small Business | Large Enterprises, Medium Business, Small Business |
| Category | Business Intelligence Software | Dashboard Software |
| Platforms | SaaS/Web/Cloud, Mobile - Android, Mobile - iOS, Installed - Windows, Installed - Mac | SaaS/Web/Cloud |
| API | Available | Available |
| Support modes | 24/7 (Live rep), Business Hours, Online | Online |
| Certifications | SOC 2, HIPAA, GDPR, ISO 27001 | GDPR |
| Data residency | Global | US |
Key differences between Tableau and Whatagraph
- Pricing: Tableau starts at $15 /user/month, while Whatagraph starts at $119 /Month.
- User satisfaction: Tableau scores higher with a 4.4-star average.
- Deployment: Tableau supports SaaS/Web/Cloud, Mobile - Android, Mobile - iOS, Installed - Windows, Installed - Mac; Whatagraph supports SaaS/Web/Cloud.
Tableau vs Whatagraph — find the better fit before you commit.
Which tool fits your team best
Which is actually cheaper for your team size
Where each product wins, per real buyers
Most Business Intelligence Software tools look identical on paper. This comparison cuts to the differences that matter — pricing structure, team fit, and what real buyers found after signing up.
Biggest differences
Features
Pricing
Buying details
Security
Buyer feedback
Integrations
Product tour
Other options
Talk to an expert Talk to an expert |
Free PDF comparison
Download this Tableau vs Whatagraph comparison
Get the full side-by-side as a PDF — these picks plus the top Business Intelligence Software tools, with verified ratings, pricing and features.
- Side-by-side on pricing, features & ratings
- Plus the category top 10, scored & ranked
- Emailed to you — no on-screen download
No file downloads on screen — we email it to you. One-click unsubscribe anytime.
Biggest differences
Start here before you go deeper into features.
Best for interactive, visually rich BI in mid-to-large enterprises.
- You need powerful, customizable dashboards with drag-and-drop ease.
- Your organization requires robust integration with diverse, live data sources.
- You want advanced AI-driven predictive analytics within your BI platform.
- You are a startup or very small business with limited budget.
- You prefer lightweight, simple BI tools without steep learning curves.
Best for marketing teams needing automated, collaborative Google Analytics reporting.
- You manage multiple Google Accounts and need seamless real-time collaboration.
- You want to automate report generation to save time and reduce manual effort.
- You prefer intuitive, customizable templates for clear and consistent data presentation.
- You require highly flexible or unique data visualization customization beyond templates.
- You are a small business with a tight budget concerned about pricing barriers.
Tableau: Best for interactive, visually rich BI in mid-to-large enterprises. Whatagraph: Best for marketing teams needing automated, collaborative Google Analytics reporting.
Description | Tableau, from Salesforce, is a leading business intelligence and analytics platform designed to help organizations of all sizes understand and act on their data with confidence. Built for ... Read More about Tableau | Whatagraph is a dashboard solution that seamlessly syncs to an unlimited number of Google Accounts. Share, customize and work with team, any team or even multiple teams in real-time with ... Read More about Whatagraph |
|---|---|---|
Entry Level Pricing |
|
|
Free Trial Availability |
| |
SpotScoreWhat's this? ↗ | 9.3/10 | 9.3/10 |
User RatingsBased on verified Spotsaas reviews | ||
Best Company Size | 50-5000 employeesLarge Enterprises | 51-500 employees500+ employees |
Get pricing help | Get pricing help |
Where each option fits best
See where each product is strongest, which teams it fits, and what causes buyers to keep looking — before you commit.
Based on buyer reviews and verified product data collected by Spotsaas.
Key strengths
- Interactive and Intuitive Data Visualization: Easily create interactive dashboards and reports with drag-and-drop tools, making data accessible to both technical and non-technical users.
- AI-Driven Insights for Smarter Decisions: Use built-in AI and machine learning to uncover trends, forecast outcomes, and guide better business decisions.
- Flexible Deployment and Integrations: Deploy on the cloud, on-premises, or within Salesforce CRM while connecting to data sources like Google Workspace, Microsoft Excel, and more.
No key benefits available yet.
Best fit
- 50–5,000 Employees
- Finance, Healthcare, Education, Technology, Retail, Government, Insurance, Manufacturing, Media
- Data Analysts, Business Intelligence Managers, IT Leaders, Developers, Operations Managers, Marketing Analysts, C-Suite Executives
No best-fit guidance available yet.
Software Demo
Demo |
|---|
Need a second opinion?
Get shortlist help from a software advisor
Share your priorities, budget, and team needs, and we’ll help you narrow the options and understand the tradeoffs before you talk to vendors.

- Independent advice — matched to your business
- Understand the tradeoffs before you talk to vendors
- Free 15-min call with a software advisor.
Step 1 of 4
How big is your team?
We tailor recommendations to companies your size.















How do Tableau and Whatagraph Compare on Features?
Total Features | 10 Features | 8 Features |
|---|---|---|
Unique Features | No unique features | No unique features |
Get Quote | Get Quote |
Compare Tableau and Whatagraph on pricing
Review starting price, plan structure, and free-trial access side by side so you can see which option fits your budget and buying process.
Pricing Option | ||
|---|---|---|
Starting From |
|
|
Pricing Plans |
|
|
Pricing Page | 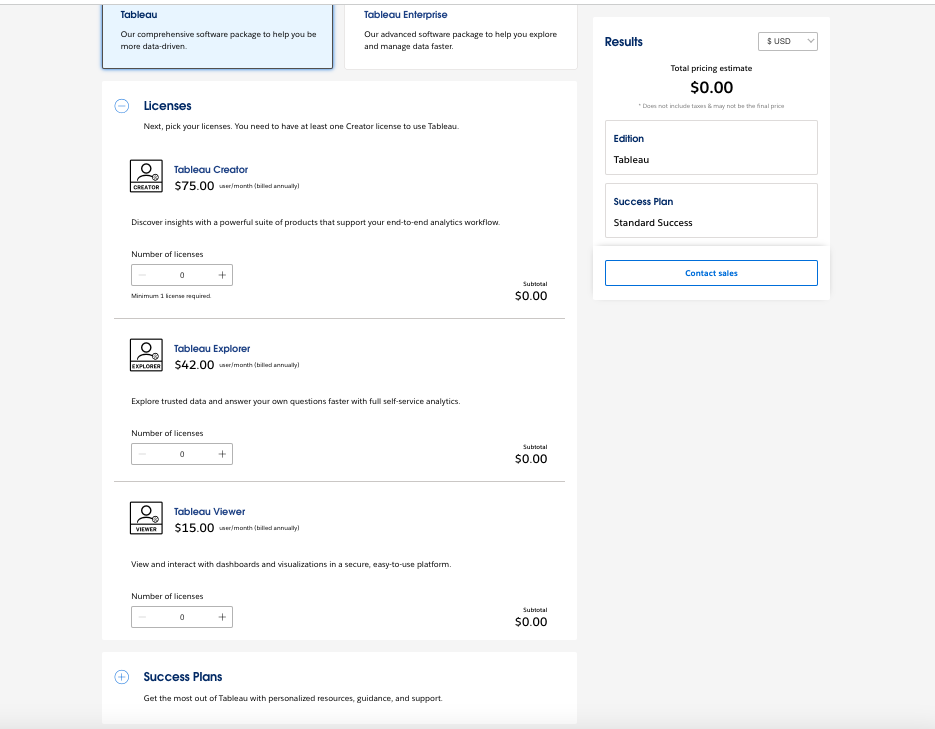 |  |
Other Details
Organization Types supported |
|
|
|---|---|---|
Platforms Supported |
|
|
Modes of support |
|
|
API Support |
|
|
Get help choosing | Get help choosing |
Security & Compliance
Certifications, data handling, and security controls for IT and compliance evaluators.
SOC 2 | ✓ Yes | — |
|---|---|---|
HIPAA | ✓ Yes | ✗ No |
GDPR | ✓ Yes | ✓ Yes |
ISO 27001 | ✓ Yes | — |
Single Sign-On (SSO) | ✓ Yes | ✓ Yes |
Multi-Factor Auth (MFA) | ✓ Yes | — |
Data Encryption | ✓ Yes | ✓ Yes |
Audit Logs | ✓ Yes | — |
Data Residency | 🌐 Global | 🇺🇸 US |
Tableau User Reviews & Rating Comparison
User Ratings | ||
|---|---|---|
Rating Distribution | ||
Spotsaas Editor’s POV generated by AI | Buyer sentiment Overall positive sentiment highlights Tableau's powerful visualization and integration capabilities, tempered by concerns over cost and learning curve. What buyers like
Common complaints
| Buyer sentiment Overall positive sentiment highlighting ease of use, automation, and customer support with some concerns about pricing and integration stability. What buyers like
Common complaints
|
Pros and Cons |
|
|
Positive Reviews | No reviews available for the product | No reviews available for the product |
| Negative Reviews | No reviews available for the product | No reviews available for the product |
List of Customers
Customers |  Verizon  Henkel  Lenovo | No Customers information available. |
|---|
Media and Screenshots
Screenshots | 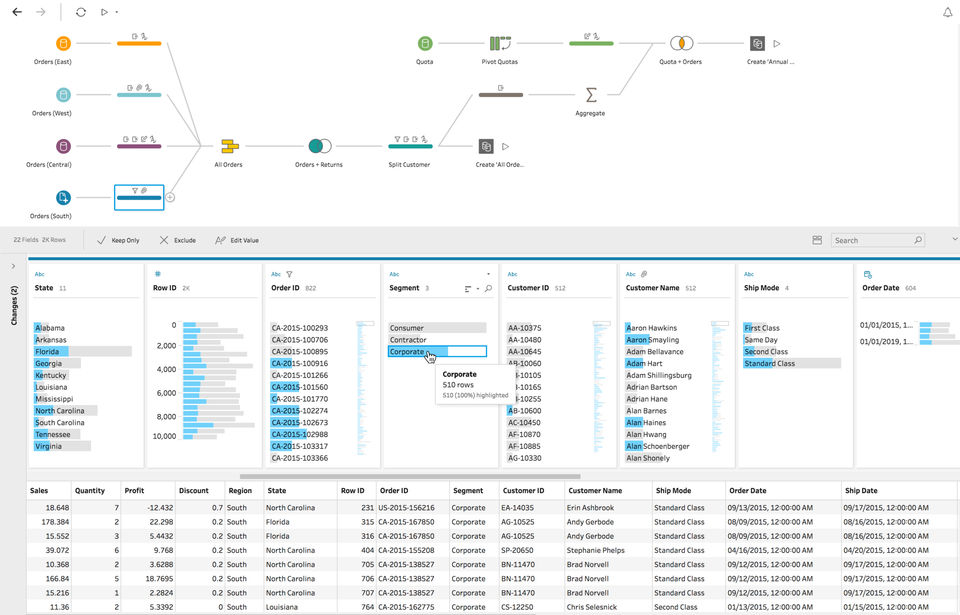 4 Screenshots |  3 Screenshots |
|---|---|---|
Videos |  3 Videos |  3 Videos |
Top Alternatives to Tableau and Whatagraph in 2026
Alternatives |
|---|


Add another option to compare side by side
Search by product name to compare pricing, fit, and buyer feedback in one view.Compare similar software options


Disclaimer: This research has been collated from a variety of authoritative sources. We welcome your feedback at [email protected].
Frequently asked questions
- Which is better, Tableau or Whatagraph?
- Tableau edges out the other on user ratings (4.4 vs 4.3). That said, the best pick depends on your use case — use the comparison tables above to evaluate each dimension.
- Do Tableau and Whatagraph offer a free trial?
- Yes, both Tableau and Whatagraph offer a free trial.
- What is the starting price of Tableau vs Whatagraph?
- Tableau starts at $15 /user/month. Whatagraph starts at $119 /Month.
- What are the top alternatives to Tableau?
- Top alternatives to Tableau include Qlik Sense, Entrinsik Informer, Looker, Microsoft Power BI, Dundas BI.
- What are the top alternatives to Whatagraph?
- Top alternatives to Whatagraph include AgencyAnalytics, Reportz, iDashboards, DashThis, myDATA3.