
Turning complex data into clear visuals can be difficult. Piktochart, an AI-powered infographic maker, makes the task easier with its simple tools and large template gallery.
This post walks you through creating strong infographics that communicate your message and connect with your audience. Read on to see how visual storytelling works in practice, from picking a template to sharing the finished design.
Key Takeaways
- Piktochart is an AI-powered tool built to make creating infographics simple, with no graphic design experience required.
- The platform offers over 600 customizable templates for a range of content, such as reports, presentations, and social media graphics.
- Users can modify and personalize templates to match their brand or message, using simple tools to add text, visuals, and data visualizations.
- Piktochart supports interactive elements like maps and videos that add to the storytelling in your visuals.
- Getting started with Piktochart takes just a few steps: signing up, choosing a template, customizing it with your data and design preferences, and then sharing the finished product.
Understanding Piktochart: An Infographic Maker
Piktochart is a tool for creating visual content that turns complex data into clear infographics. Its simple interface lets people of all skill levels design infographics without prior graphic design experience, so you can focus on the message rather than the software.
Through data visualization, Piktochart turns numbers and statistics into visuals that are easy to understand, helping you tell a story with your data instead of a plain spreadsheet.
It covers a broad range of needs, from presentation design to social media graphics, with over 600 templates ready to personalize. Whether you work at a school that needs interactive media tools or on a marketing team aiming for reach on social media, Piktochart fits the job.
Beyond static images, it adds dynamic elements like interactive maps and hyperlinks that give reports and presentations a level of interactivity that is rare in other graphic software.
Benefits of Using Piktochart
Piktochart is simple and easy to use, letting you create a range of visual content from customizable templates. The platform supports brand alignment and clear visuals for communicating information, so your reports and graphics stay consistent with the way your team presents itself.
Simplicity and Ease-of-Use
Creating infographics does not have to be complicated. Piktochart keeps things simple, with an intuitive platform that makes design accessible to everyone.
Users find the interface clear and straightforward, without the barriers that often come with graphic design software. The tools are easy to navigate, so people at all skill levels can produce professional-looking visuals.
Piktochart can turn anyone into a designer, with no training or graphic design experience needed. You can learn the tool in under an hour and start creating without a steep learning curve to hold you back.
This approach helps users turn their ideas into engaging visual content quickly, which supports clearer communication with readers who take in a chart faster than a wall of text.
Variety of Visual Content Creation
Piktochart helps you bring your data to life through a range of visual content options. Whether you need an infographic that tells a story or detailed annual report visualizations, the tool covers it.
With its simple interface, you can turn complex information into easy-to-understand statistical graphics without any previous design experience, whether you are building a one-off chart or a full set of report visuals.
Piktochart’s templates give a strong foundation for all kinds of projects. You can customize these templates to fit your brand and message, making each piece of content your own.
Once your visual is done, sharing it is simple. Download it in crisp PNG or professional PDF format and send it to colleagues by email, so your insights get seen and understood.
Customizable Templates
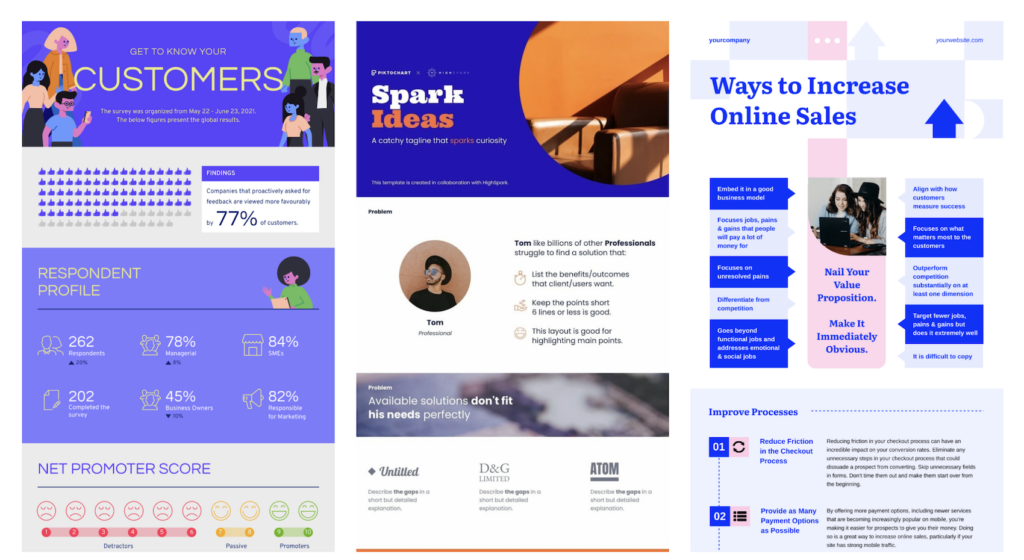
With over 600 customizable templates, Piktochart lets users create infographics, presentations, posters, reports, flyers, and social media visuals. These editable designs support personalized layouts that suit individual needs and preferences.
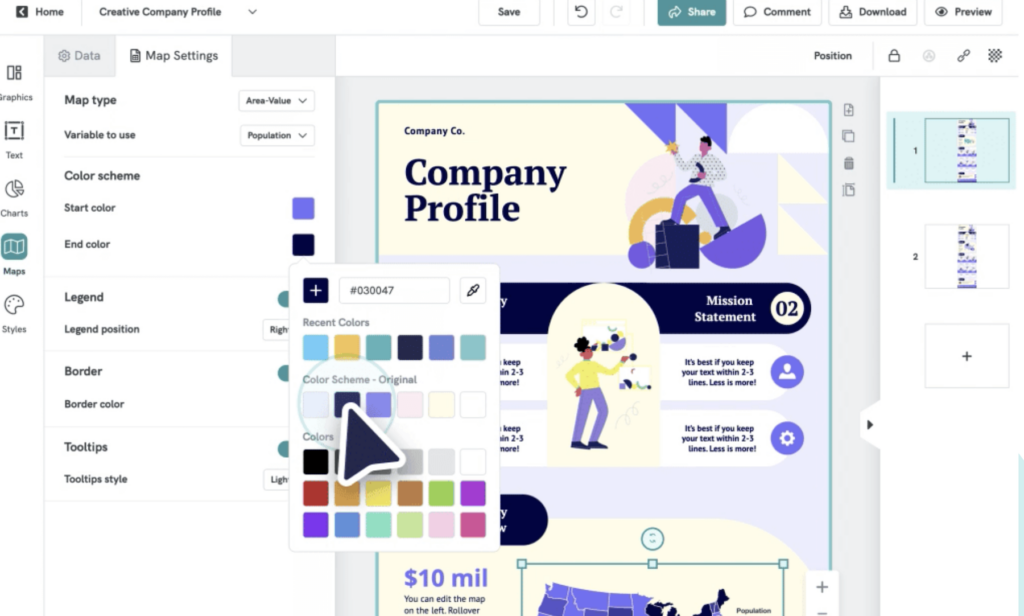
Users can adjust themes and layouts to create custom designs with editable presets and graphics. You can change colors, swap images, and rework the layout until the template fits the piece you have in mind.
Because the templates are editable, each user can shape them to match their own vision. That flexibility makes it easier to create unique visual content that stands out in professional or personal contexts, and it means two people starting from the same template can end up with very different results.
How to Create Stunning Infographics and Reports with Venngage

How to Get Started with Piktochart
To get started with Piktochart, follow these simple steps:
- Create an account on the Piktochart website using your email address or social media account.
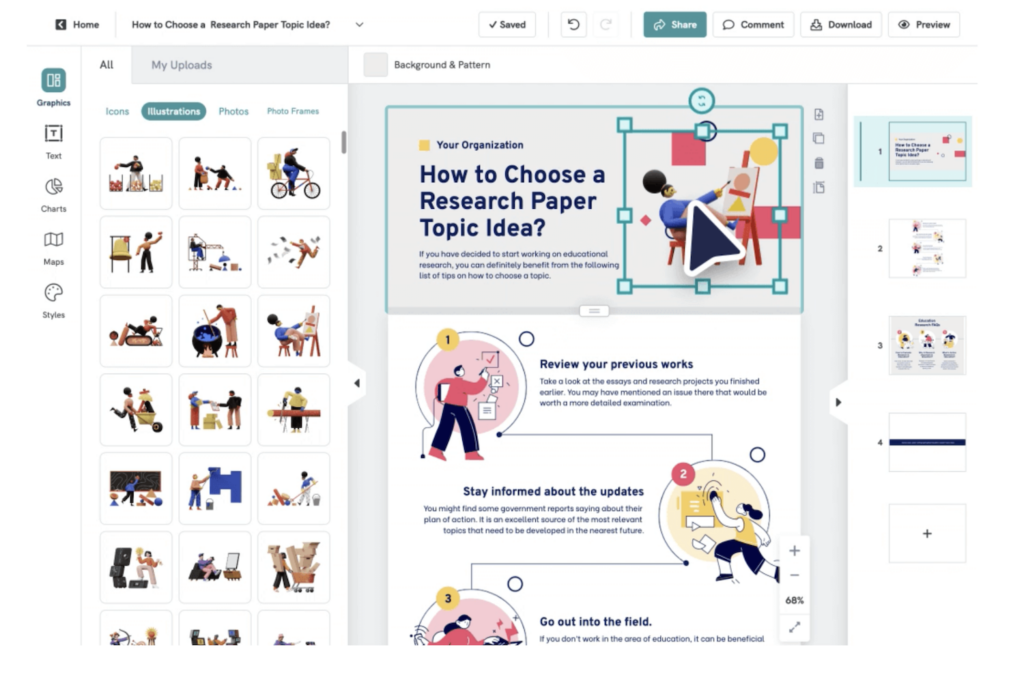
- Explore the interface and get familiar with the available tools and features.
- Choose a template that best suits your infographic needs, whether it is for data visualization, visual storytelling, or chart creation.
- Customize your chosen template by adding text, visuals, and graphics to convey your message.
- Use Piktochart’s graph maker to turn raw data into clear visualizations for your audience.
- Use Piktochart Video to edit videos within the platform for stronger visual storytelling.
- Experiment with different design elements, color schemes, and fonts to create a professional-looking infographic that aligns with your brand identity and message.
Conclusion
Create clear, impactful infographics with Piktochart’s intuitive platform. Its easy-to-use interface means no graphic design experience is needed to produce professional-grade visual content.
Turn data into visual stories that hold your audience’s attention and drive engagement. Start building infographics today using the tools and customizable templates that Piktochart provides.
Improve your content with Piktochart’s AI-powered infographic maker and leave a strong impression on your audience, whether you are sharing a report, a presentation, or a social media post.
(Image Credit: Piktochart)
Frequently Asked Questions
How can I start creating infographics with Piktochart?
To begin creating infographics with Piktochart, sign up for a free account on their website and explore the available templates and tools.
Are there any design skills required to use Piktochart for infographics?
No, you do not need advanced design skills to create infographics with Piktochart. The platform offers easy-to-use templates and drag-and-drop editing.
Can I customize the colors and fonts of my infographics in Piktochart?
Yes, you can customize the colors and fonts in your infographics using the editing tools that Piktochart provides.
What are some practical benefits of using Piktochart for infographic creation?
Using Piktochart helps you present complex information visually, engage your audience, and improve the look of your presentations or reports.
Is it possible to share and download my finished infographics from Piktochart?
Yes, once finished, you can share your infographics directly from the platform or download them in formats such as PNG or PDF.
Related Articles

Accounting Software
Free Design Tools: Say Goodbye to Boring Invitations in 2026
Continue reading →

Accounting Software
Best QuickBooks Alternatives in 2026: Top Accounting Software Options
Continue reading →

Accounting Software
Best Accounting Software for Small Business in 2026 – Top 3 Picks
Continue reading →

Accounting Software
Top 10 Free Accounting Software in 2026 – Best Picks for Small Businesses
Continue reading →