

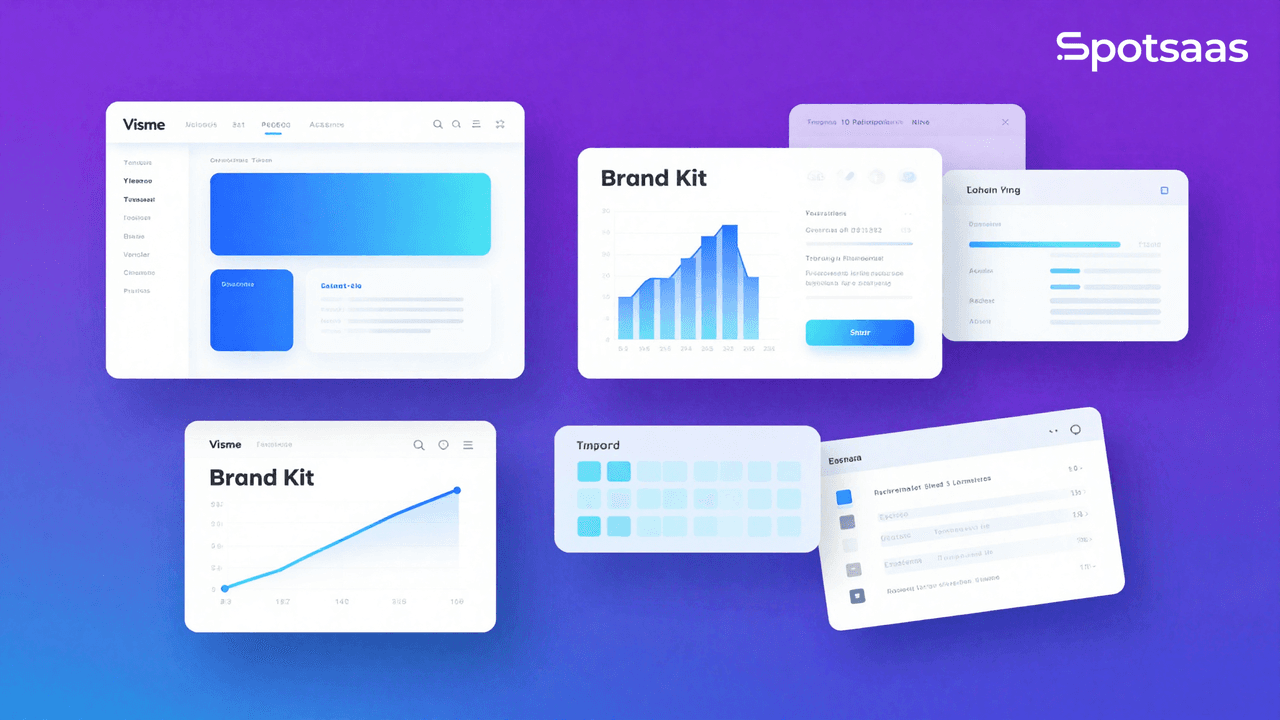
Building engaging presentations and infographics is hard without the right tools. Visme makes visual communication simpler for its 23 million users.
This article walks through how to build polished, professional-looking visuals with Visme’s online platform, from picking a template to sharing a finished project.
Key Takeaways
- Visme is a platform for building presentations and infographics, with 23 million users that include companies like IBM.
- It ships a large collection of customizable templates and design tools, so non-designers can produce professional-looking visuals.
- You can add interactive elements and animations to hold an audience’s attention through dynamic storytelling.
- The workflow is straightforward: pick a template for your need, add your own or your brand’s touches, and plot data with charts and graphs.
- Collaboration features let teams work on the same project and keep branding consistent across every piece.
What is Visme?

Visme is an online platform for creating and sharing professional presentations and infographics. Its design tools are approachable, so anyone can put together eye-catching content without a design background.
Users work from a large library of customizable templates and drag-and-drop graphics, which keeps data visualization within reach for beginners. You start from a design that already works and change the parts that matter, rather than facing a blank canvas.
The tool goes past static images. It adds interactivity and animations, so you can present complex data or tell a story and produce branded content that holds attention. That range is what lets one project double as a live web page, a downloadable file, or an embedded chart, depending on how you plan to share it.
From marketers building reports to educators designing course materials, professionals across industries use Visme for visual storytelling.
Benefits of using Visme for Infographics and Presentations

Visme pairs simple design tools with customizable templates and interactive content and animations, which shortens the work of making a professional presentation or infographic.
Its interface and wide set of design assets make it a practical choice for non-design professionals who need visual content that looks the part. Marketers use it for reports, educators use it for course materials, and teams use it for proposals, all from the same set of templates and tools.
Simple design tools
Visme’s design tools make presentations and infographics manageable even for people with no graphic design experience. You drag and drop elements into place, so you assemble a layout instead of building one from scratch. The same editor handles slides and infographics, which keeps the learning curve short once you know one format.
You can turn plain data into charts, or fold dense information into clear, colorful infographics, in a few clicks.
Customizable templates give each project a starting point and cut the setup work. They are built to look good and stay readable, so your message comes through while the design still stands out.
With 23 million users applying these tools to their businesses and projects, including IBM, the platform has a proven track record. Its ratings back up how well it helps non-designers produce visual content, interactive material, and storytelling across formats.
Customizable templates
Visme’s customizable templates let you build visual stories quickly. Whether you need presentations, infographics, or marketing materials, the templates give you a running start and save time.
Pick from a library of designs made for different industries and purposes, then adjust every part of the project, from fonts and colors to layouts and images, so it matches your brand. Because each template is fully editable, a design that starts as a sales deck can be reworked into a one-page report without starting over.
Turning complex data into clear visuals is simpler here. Users convert dry statistics using the chart and graph tools built into each template, then place the result on a slide or inside an infographic without exporting it elsewhere.
Collaboration features let teams work on the same creative assets and keep branding consistent across every piece. That consistency helps your visual message land and stick.
Interactive content and animations
Beyond static templates, Visme adds interactive content and animations to presentations and infographics. Lively visuals help an audience follow and remember what you present, and motion can guide the eye through a sequence of points in the order you intend.
Add animated graphics to bring data to life and hold viewers’ attention. Interactive features fit into your designs without extra tooling, so a chart can reveal figures on hover or a slide can link straight to a related section. These touches suit product walkthroughs, pitch decks, and reports that readers explore at their own pace.
How to create Presentations using Visme
Pick a template that fits your topic, then add and customize content to build professional slides. The steps below cover the full process.
Selecting a template
Browse Visme’s template library to find a layout for your presentation. There are options for professional content and for social media marketing.
Choosing a template and shaping it to your brand saves time while keeping the result professional. Customizable designs and built-in sharing make the presentation quick to finish. Since the layout, spacing, and slide order are already set, most of your effort goes into the content rather than the formatting.
Adding and customizing content
To add and customize content on Visme for your presentations, follow these steps:
- Select a template from Visme’s library to start your design.
- Add text, images, videos, and other media to your slides to make the presentation your own.
- Use Visme’s drag-and-drop interface to arrange and format content.
- Adjust fonts, colors, and backgrounds to match your brand or personal style.
- Pull from Visme’s collection of icons, illustrations, and graphics to round out your content.
- Add interactive elements such as buttons, links, or animations to engage your audience.
How to create Infographics using Visme
Pick a template that fits your data, whether you’re showing statistics, timelines, or process flows. Then customize and brand the infographic so it holds up in front of your audience.
The sections below cover each step of building an infographic in Visme.
Choosing a template
Choosing the right template is the first step in building an infographic. With a range of professionally designed templates, you can find one that fits your brand and message.
Once you’ve picked a template, adding content is quick because the layout is already set up for visual storytelling. Adjusting colors, fonts, and images ties the template to your brand.
Plot data with charts and graphs by entering your numbers and letting Visme render them. The interface is simple enough to build a standout infographic without design experience. You can swap chart types, relabel axes, and recolor series after the data is in, so the same figures can be shown as a bar graph one day and a pie chart the next.
Visualizing data with charts and graphs
Turning statistics and figures into clear visuals is simple with Visme’s customizable templates. Pie charts, bar graphs, scatter plots, and more are available for building data visualizations.
You can carry your brand into the infographics by setting color schemes, fonts, and company logos. Teams can also collaborate and plot data on maps through platforms like Google Maps.
For professionals who need clear data visuals in reports and proposals, Visme is a solid fit. The mix of chart tools, map support, and brand controls covers most of what a report needs without moving between separate apps.
Customizing and branding your infographic
Customizing and branding your infographic is a key step in making it look professional. Visme’s customization options let you match your brand and carry your message clearly. Here’s how to personalize and brand an infographic in Visme:
- Shape the design: Choose from professional templates, animated icons, characters, and fonts to set the look and feel of your infographic.
- Visual storytelling: Use Visme’s design tools to build graphics that match your brand and carry more visual weight.
- Customization options: Add interactive content, charts and graphs, and color themes to present information in a way your audience follows while staying on brand.
- Brand identity: Bring in your logos, color schemes, and fonts so the infographic stays consistent with your other visual content.
Conclusion
Visme’s template library and design tools make building professional presentations straightforward. You can present complex data through custom infographics, charts, and graphs.
Interactive features add another layer to your brand’s content and help it stay with viewers. The result is visual stories that connect with your audience. With templates, charts, animations, and collaboration in one place, most of a project can be built and shared without leaving the tool.
Try Visme with joinUnlock and take your visual communication skills further.
Want to sharpen your presentations further? See how Greenshot can pair with your Visme work for screen capture and annotation.
FAQs
How do I start creating a presentation in Visme?
Start by picking a template from Visme’s selection of professional designs.
Can I customize the color scheme and fonts in my presentation or infographic?
Yes. You control the color palette and typography, so you can match your brand or personal style.
Are there any design elements available for adding visual appeal to my project?
Yes. There is a large library of icons, illustrations, photos, and shapes for your projects.
Can I collaborate with others on a presentation or infographic within Visme?
Yes. Visme’s collaborative features let several team members work together on the same project.
What export options are available for sharing my finished work outside of Visme?
You can export projects as image files (PNG or JPG), PDFs, interactive HTML presentations, embed codes for websites, and more.

- Independent picks for exactly what you just read about
- Matched to your team size & needs
- Vendors don't pay for placement
Step 1 of 4
How big is your team?
We tailor recommendations to companies your size.















Related Articles
Buyers guide
Twilio Alternatives 2026: 6 Compared and What They Cost
Continue reading →
IT Management
RMM Software: 25 Tools Ranked by 1,843 Reviews
Continue reading →
Buyers guide
How To Choose The Best Freelance Platforms For 2026
Continue reading →
Best Tools
SaveFrom.net: Norton Clears It, the Ads Are the Risk
Continue reading →