

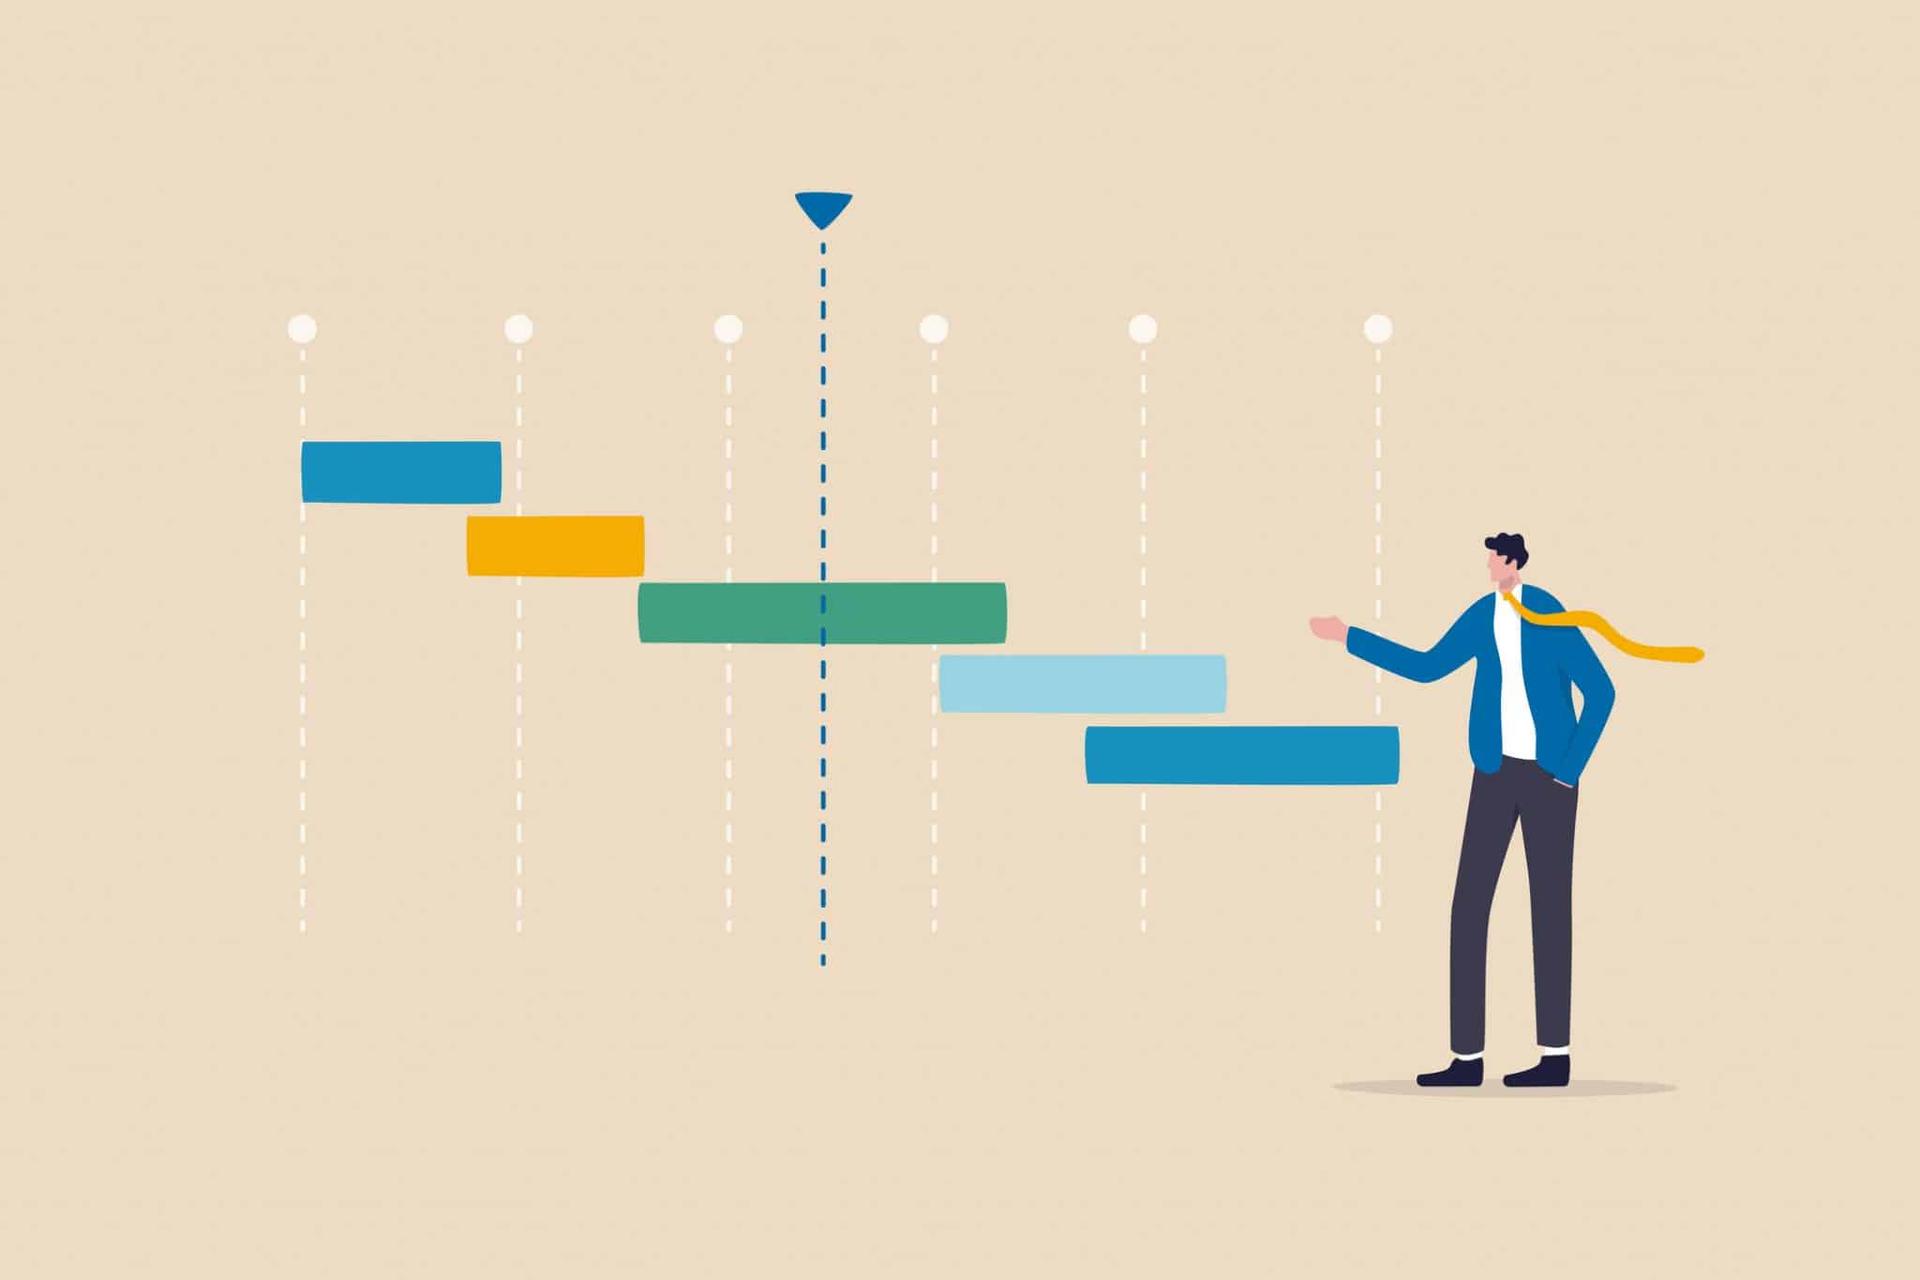
A Gantt chart is a visual tool used in project management to represent a project’s timeline and progress. It consists of horizontal bars representing tasks, with their start and end dates plotted against a calendar. This simple, effective representation lets project managers and team members quickly understand task dependencies, spot potential bottlenecks, and monitor progress in real-time, whether the project has five tasks or fifty.
Table of Contents
TL;DR
- Gantt charts: essential for project management
- Visualize project timelines and task dependencies
- Free online tools available (e.g., Google Sheets, Excel, Asana)
- Alternatives: Kanban boards, network diagrams, burndown charts
- Choose the best tool based on project requirements and team size
Importance and Applications of Gantt Charts in Project Management
Gantt charts play a central role in project management, from initial planning through execution. They serve several practical functions:
- Streamlining communication: Gantt charts give a clear, easy-to-understand visual representation of a project’s timeline, which makes it easier for team members, stakeholders, and clients to stay on the same page.
- Improving resource allocation: by showing task dependencies and durations, Gantt charts help project managers allocate resources more efficiently and avoid overloading or underusing team members.
- Tracking progress: Gantt charts offer real-time insight into project status, making it easier to spot delays and adjust plans as needed.
- Supporting decision-making: with a full view of a project’s timeline, project managers can make better-informed decisions about prioritizing tasks, reallocating resources, and adjusting schedules.
Overview of Free Online Gantt Chart Options
There’s no shortage of free online Gantt chart tools that cover various project management needs. Popular options include Google Sheets, Microsoft Excel, and dedicated online Gantt chart platforms. Each offers its own mix of customization and ease of use, so the right pick often comes down to what you’re already comfortable using day to day.
Google Solutions for Gantt Charts
Creating a Gantt Chart using Google Sheets
Google Sheets, a popular cloud-based spreadsheet application, offers a simple and accessible way to build Gantt charts for project management. Google Sheets doesn’t include a built-in Gantt chart template, but you can build one from scratch or use a pre-made template found online. Here’s how:
- Open Google Sheets and create a new, blank spreadsheet.
- In the first column, list all the tasks involved in your project.
- In the second column, input the start dates for each task.
- In the third column, enter the duration of each task in days.
- In the fourth column, calculate the end date for each task by adding the start date and duration.
- Use conditional formatting to create horizontal bars that visually represent each task’s duration and position on the timeline.
Available Google Gantt Chart Apps and Add-ons
Several third-party apps and add-ons can help you build Gantt charts in Google Sheets more efficiently. Popular options include:
- Gantt Chart Generator: this add-on automates the Gantt chart creation process, letting you input tasks, durations, and dependencies to generate a Gantt chart in just a few clicks.
- Project Timeline: this app creates a visually appealing Gantt chart that you can customize and share with your team, which helps streamline project communication.
To find these apps and add-ons, go to the “Add-ons” menu in Google Sheets, select “Get add-ons,” and search for the tool you want.
Microsoft Solutions for Gantt Charts
Microsoft Excel is a versatile tool for project management, including building Gantt charts. Excel doesn’t have a dedicated Gantt chart feature, but you can use its charting capabilities to build one from scratch. Here’s a brief overview of the process:
- Enter tasks, start dates, durations, and end dates in separate columns.
- Use the stacked bar chart type to represent the tasks and their durations.
- Customize the chart’s appearance to resemble a Gantt chart, including adjusting the horizontal axis and hiding specific bars.
Free Alternatives to Microsoft Project for Gantt Charts
Microsoft Project is a powerful project management software with built-in Gantt chart functionality, but it can be expensive for those on a budget. Here are some free alternatives that offer Gantt chart capabilities:
- GanttProject: an open-source project management tool with Gantt chart features, letting you create, edit, and export Gantt charts.
- ProjectLibre: another open-source project management tool with Gantt chart functionality, plus other useful features like resource management and cost tracking.
Creating a Gantt Chart in Microsoft Word for Free
Microsoft Word isn’t built for creating Gantt charts, but you can still put together a basic one using Word’s table and drawing tools. Here’s how:
- Create a table with columns for tasks, start dates, durations, and end dates.
- Fill in the table with your project’s information.
- Use the drawing tools to create horizontal bars representing each task’s duration and position on the timeline.
- Customize the appearance of your Gantt chart as desired.
Keep in mind this method isn’t as dynamic as using Excel or a dedicated Gantt chart tool, and you’ll need to manually update the chart as your project progresses, rebuilding the bars by hand every time a date shifts.
Choosing the Best Microsoft Program for Gantt Charts
The best Microsoft program for building Gantt charts depends on your needs, your budget, and your preferences. Here’s a brief comparison of the three main options:
- Microsoft Excel: offers flexibility and customization, making it suitable for small to medium-sized projects with straightforward task dependencies.
- Microsoft Word: provides a simple solution for basic Gantt charts, best for small projects with minimal timeline adjustments.
- Microsoft Project (paid): ideal for complex projects with numerous tasks, dependencies, and resources, offering advanced project management features alongside a full Gantt chart experience.
If you’re just starting out, Excel or Word are reasonable places to build simple Gantt charts for a small project. As your project management needs grow more complex, dedicated Gantt chart tools or Microsoft Project become worth the investment for their more advanced features.
Free Online Gantt Chart Tools
Here’s a list of popular free online Gantt chart tools, with a brief description of each:
- Trello: a flexible project management tool based on the Kanban methodology. By integrating the “Elegantt” or “TeamGantt” Power-Ups, you can add Gantt chart functionality to your Trello boards.
- Asana: a popular task and project management platform that lets you build Gantt charts using the Timeline view, available in the free version for projects with up to 15 team members.
- ClickUp: a comprehensive project management solution that includes Gantt chart functionality in its free plan, letting you create dependencies, adjust timelines, and visualize project progress.
- GanttPRO: a dedicated Gantt chart tool with a user-friendly interface. The free plan offers limited features and allows only one user and one project, making it suitable for small projects or personal use.
- TeamGantt: a web-based Gantt chart tool with a simple drag-and-drop interface. The free plan accommodates up to three users and one project, ideal for small teams.
Features and Limitations of Free Gantt Chart Tools
Features:
- Most free Gantt chart tools offer drag-and-drop functionality, making it easy to build and adjust project timelines.
- Many tools include collaboration features, letting team members comment on tasks, share files, and assign responsibilities.
- Some free Gantt chart tools integrate with popular project management platforms, adding to your overall project management setup.
Limitations:
- Free Gantt chart tools often limit the number of users or projects you can have on a free plan.
- Advanced features, such as resource management, cost tracking, and custom reporting, may only be available on paid plans.
- Some tools lack advanced customization options or the ability to import/export data in specific formats.
Tips for Selecting the Best Free Gantt Chart Tool for Your Needs
- Identify your project’s requirements: consider your team size, the complexity of your project, and the features you actually need in a Gantt chart tool.
- Evaluate the ease of use: if you’re new to Gantt charts, look for a tool with an intuitive interface and clear instructions that help you build and manage your timeline.
- Check for integration capabilities: if you already use a project management platform, make sure the Gantt chart tool you choose can integrate with it.
- Assess collaboration features: look for tools that let your team communicate, assign tasks, and share files within the Gantt chart interface itself.
- Consider scalability: as your projects and team grow, you may need more features or capacity, so pick a tool with upgrade options that suit your future needs.
Weighing these factors will help you pick the free Gantt chart tool that lets you manage your projects effectively and efficiently, instead of settling for whichever one you tried first.
Alternatives to Gantt Charts
Overview of Alternative Project Management Visualization Techniques
Gantt charts are popular and effective, but other visualization techniques can also be useful in project management. Here are a few alternatives:
- Kanban boards: a visual tool that represents tasks as cards on a board divided into columns, showing different stages of progress. This method works well for managing workflows and keeping work evenly distributed among team members.
- Network diagrams (PERT/CPM): these diagrams display tasks as nodes connected by arrows to indicate dependencies and sequences. Network diagrams can help identify the critical path in a project, letting project managers focus on the tasks with the biggest impact on completion time.
- Burndown charts: these charts track the remaining work in a project over time, comparing actual progress against planned progress. Burndown charts are especially useful in Agile project management for monitoring team performance and adjusting plans accordingly.
Comparing the Pros and Cons of Gantt Charts and Alternatives
Pros and Cons of Gantt Charts
| Pros 👍 | Cons 👎 |
|---|---|
| Provide a clear visual representation of the project timeline and task dependencies | Can become cluttered and difficult to read for large, complex projects |
| Useful for tracking progress and identifying bottlenecks | May not be ideal for Agile project management or projects with frequent changes |
| Easy to understand, facilitating communication among team members and stakeholders | Limited in tracking resource allocation and team performance |
Pros and Cons of Alternative Visualizations
| Pros 👍 | Cons 👎 |
|---|---|
| Offer different perspectives on project progress and team performance | May not provide a comprehensive view of the project’s timeline and dependencies |
| Can be better suited to specific project management methodologies (e.g., Agile) | Can be more challenging to understand for stakeholders not familiar with the specific visualization technique |
| Some alternatives provide more clarity for large, complex projects | Might require additional tools or training for team members to use effectively |
Recap of the Importance of Gantt Charts in Project Management
Gantt charts are an essential tool in project management, helping to streamline communication, improve resource allocation, track progress, and support better decision-making. Incorporating a Gantt chart, or a suitable alternative, into your planning and execution process is a practical step worth taking for teams of any size.
If you’re new to project management, it’s worth getting familiar with the different tools and techniques available, Gantt charts included. Working through the free online Gantt chart options covered in this article can help you plan, manage, and execute projects effectively, no matter their size or complexity, and without paying for software you may only need occasionally.
Frequently Asked Questions
What is a Gantt chart?
A Gantt chart is a visual representation of a project’s timeline, illustrating tasks, their durations, start and end dates, and dependencies, making it an essential tool in project management.
How can I create a Gantt chart for free online?
You can create a Gantt chart using free tools like Google Sheets or Microsoft Excel, or explore dedicated Gantt chart platforms like Trello, Asana, ClickUp, GanttPRO, and TeamGantt, which offer free plans with varying features and limitations.
What are some alternatives to Gantt charts for project management visualization?
Alternative visualization techniques include Kanban boards, network diagrams (PERT/CPM), and burndown charts, each providing different perspectives on project progress and team performance.
How do I choose the best Gantt chart tool for my needs?
Consider factors like your project’s size and complexity, team size, desired features, ease of use, integration capabilities, collaboration features, and scalability when selecting a Gantt chart tool.
Are Gantt charts suitable for Agile project management?
While Gantt charts can be used in Agile project management, they may not be ideal for projects with frequent changes or require detailed tracking of team performance. In such cases, alternatives like Kanban boards and burndown charts may be more suitable.
Compare alternatives to the tools in this post

- Independent picks for exactly what you just read about
- Matched to your team size & needs
- Vendors don't pay for placement
Step 1 of 4
How big is your team?
We tailor recommendations to companies your size.














Related Articles

Project Management
Best Project Management Software for Small Business in 2026: 8 Tools Compared
Continue reading →
Project Management
ClickUp vs Asana (2026): Which PM Tool Is Right for Your Team?
Continue reading →

Project Management
11 Best Asana Alternatives in 2026 (Cheaper, Simpler, or More Powerful)
Continue reading →

Project Management
How to Use Doodle Polls for Fast, Group Scheduling 2026 Guide
Continue reading →