PRTG Network Monitor vs Grafana Comparison
PRTG Network Monitor
Starting at Contact for pricing
- Free Trial
- Large Enterprises
- Medium Business
Network Monitor is a powerful and comprehensive network monitoring software for Windows and Linux systems. The PRTG Network Monitor offers continuous monitoring of all important parameters of servers, PCs, and other netw…
Grafana
Starting at $49 /Month
- Free Trial
- Large Enterprises
- Medium Business
Grafana is a feature-rich metrics dashboard and graph editor. It provides rich visualizations for time series data, including support for granular continuous and discrete triggers such as changes in context, changes in m…
Grafana leads on user satisfaction with a 4.5-star rating across 50 reviews.
PRTG Network Monitor vs Grafana — at a glance
| Feature | PRTG Network Monitor | Grafana |
|---|---|---|
| Rating | 4.4 / 5 | 4.5 / 5 |
| Reviews | — | 50 |
| Starting price | Contact for pricing | $49 /Month |
| Free trial | Yes | Yes |
| Free version | No | No |
| Best for | Large Enterprises, Medium Business, Small Business | Large Enterprises, Medium Business, Small Business |
| Category | Network Monitoring Software | Dashboard Software |
| Integrations | — | 1+ apps |
| Platforms | SaaS/Web/Cloud, Mobile - Android, Mobile - iOS, Installed - Windows | SaaS/Web/Cloud, Installed - Windows, Installed - Mac |
| API | Available | Available |
| Support modes | Business Hours, Online | Online |
| Certifications | GDPR | SOC 2, GDPR |
| Data residency | — | Global |
Key differences between PRTG Network Monitor and Grafana
- Pricing: Grafana starts at $49 /Month. PRTG Network Monitor pricing is not publicly listed.
- User satisfaction: Grafana scores higher with a 4.5-star average.
- Deployment: PRTG Network Monitor supports SaaS/Web/Cloud, Mobile - Android, Mobile - iOS, Installed - Windows; Grafana supports SaaS/Web/Cloud, Installed - Windows, Installed - Mac.
PRTG Network Monitor vs Grafana — find the better fit before you commit.
Which tool fits your team best
Which is actually cheaper for your team size
Where each product wins, per real buyers
Most Network Monitoring Software tools look identical on paper. This comparison cuts to the differences that matter — pricing structure, team fit, and what real buyers found after signing up.
Biggest differences
Features
Pricing
Buying details
Security
Buyer feedback
Integrations
Product tour
Other options
Talk to an expert Talk to an expert |
Biggest differences
Start here before you go deeper into features.
Best for comprehensive, real-time network monitoring with customizable alerts.
- You need detailed monitoring across diverse devices and APIs in medium-sized businesses.
- Your team consists of network administrators or IT managers requiring unified infrastructure views.
- You want a flexible, configurable tool with real-time and historical data insights.
- Your organization requires extensive third-party app integrations beyond limited marketplace options.
- Your team lacks access to proper training and may struggle with the steep learning curve.
Best for flexible, real-time monitoring dashboards with extensive data source integrations.
- You need customizable dashboards for IT infrastructure or DevOps monitoring.
- Your team requires seamless integration with tools like Prometheus and Loki.
- You want an open-source platform with a rich plugin ecosystem for extensibility.
- You require advanced alerting features for complex scenarios beyond basic triggers.
- You need a quick, out-of-the-box deployment with minimal setup effort.
PRTG Network Monitor: Best for comprehensive, real-time network monitoring with customizable alerts. Grafana: Best for flexible, real-time monitoring dashboards with extensive data source integrations.
Description | Network Monitor is a powerful and comprehensive network monitoring software for Windows and Linux systems. The PRTG Network Monitor offers continuous monitoring of all important parameters ... Read More about PRTG Network Monitor | Grafana is a feature-rich metrics dashboard and graph editor. It provides rich visualizations for time series data, including support for granular continuous and discrete triggers such as ... Read More about Grafana |
|---|---|---|
Entry Level Pricing |
|
|
Free Trial Availability | ||
Spotsaas ScoreWhat's this? ↗ | 9.8/10 | 9.4/10 |
User RatingsBased on verified Spotsaas reviews | ||
Best Company Size | 50 to 5000 employeesMedium Business | 51-500 employees500+ employees |
Get pricing help | Get pricing help |
Where each option fits best
See where each product is strongest, which teams it fits, and what causes buyers to keep looking — before you commit.
Based on buyer reviews and verified product data collected by Spotsaas.
Key strengths
- Comprehensive Network Visibility: PRTG Network Monitor provides a unified view of your entire IT infrastructure, allowing managers and administrators to easily track performance metrics and identify potential issues before they escalate.
- Real-Time Monitoring: With its real-time monitoring capabilities, you can stay ahead of network fluctuations and outages. This ensures that your team can respond promptly, minimizing downtime and maintaining productivity.
- Customizable Alerts: Users appreciate PRTG’s customizable alert system. You can set thresholds tailored to your specific needs, ensuring that you receive timely notifications about critical events that matter most to your business.
No key benefits available yet.
Best fit
- 50 to 5,000 employees.
- IT and Network Management, Telecommunications, Education, Healthcare, Manufacturing, and SaaS.
- Network Administrators, IT Managers, System Engineers, and DevOps Professionals.
No best-fit guidance available yet.
Reasons buyers look elsewhere
- Users may seek alternatives due to PRTG's pricing structure, especially for smaller organizations or those with limited budgets, as the cost can escalate significantly with the number of sensors required for comprehensive monitoring.
- Some organizations might find PRTG's interface overwhelming or complex, prompting them to explore simpler, more user-friendly monitoring solutions that can be easily navigated by team members without extensive training.
- For businesses needing specific features, such as advanced reporting or integrations with other tools, alternatives may offer tailored functionalities that better meet unique operational requirements or existing technology stacks.
No alternatives guidance available yet.
Software Demo
Demo |
|---|
Need a second opinion?
Get shortlist help from a software advisor
Share your priorities, budget, and team needs, and we’ll help you narrow the options and understand the tradeoffs before you talk to vendors.
How do PRTG Network Monitor and Grafana Compare on Features?
Total Features | 11 Features | 18 Features |
|---|---|---|
Unique Features | No unique features | No unique features |
Get Quote | Get Quote |
Compare PRTG Network Monitor and Grafana on pricing
Review starting price, plan structure, and free-trial access side by side so you can see which option fits your budget and buying process.
Pricing Option | ||
|---|---|---|
Starting From |
|
|
Pricing Plans |
|
|
Pricing Page |  | 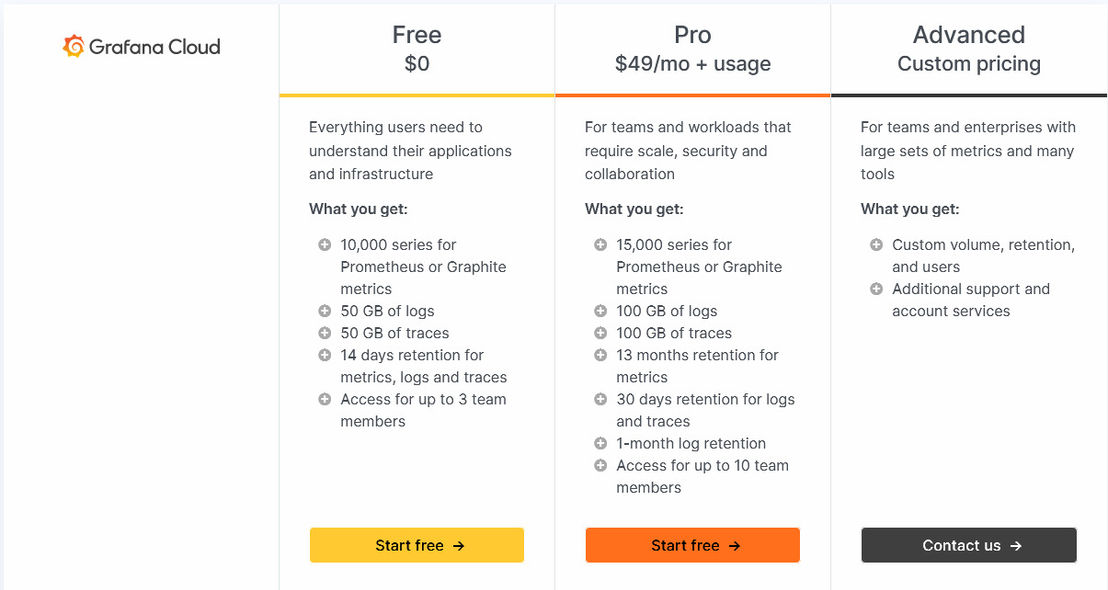 |
Other Details
Organization Types supported |
|
|
|---|---|---|
Platforms Supported |
|
|
Modes of support |
|
|
API Support |
|
|
Get help choosing | Get help choosing |
Security & Compliance
Certifications, data handling, and security controls for IT and compliance evaluators.
SOC 2 | — | ✓ Yes |
|---|---|---|
GDPR | ✓ Yes | ✓ Yes |
Single Sign-On (SSO) | ✓ Yes | ✓ Yes |
Multi-Factor Auth (MFA) | — | ✓ Yes |
Data Encryption | ✓ Yes | ✓ Yes |
Audit Logs | ✓ Yes | ✓ Yes |
Data Residency | — | 🌐 Global |
PRTG Network Monitor User Reviews & Rating Comparison
User Ratings | No reviews available for the product | |
|---|---|---|
Rating Distribution | ||
Spotsaas Editor’s POV generated by AI | Buyer sentiment Overall positive sentiment highlights PRTG Network Monitor's ease of use, powerful monitoring capabilities, and reliability, with some concerns about complexity for new users and limited integration options. What buyers like
Common complaints
| Buyer sentiment Overall positive sentiment highlights Grafana's flexibility, user-friendly dashboards, and strong integration capabilities, tempered by some concerns about alerting limitations and setup complexity. What buyers like
Common complaints
|
Pros and Cons |
|
|
Positive Reviews | No reviews available for the product | No reviews available for the product |
Integrations
Integration with other apps | No Integration information available. |
|---|
List of Customers
Customers | No Customers information available. |  Roblox  asos Sky Italia |
|---|
Media and Screenshots
Screenshots |  2 Screenshots | 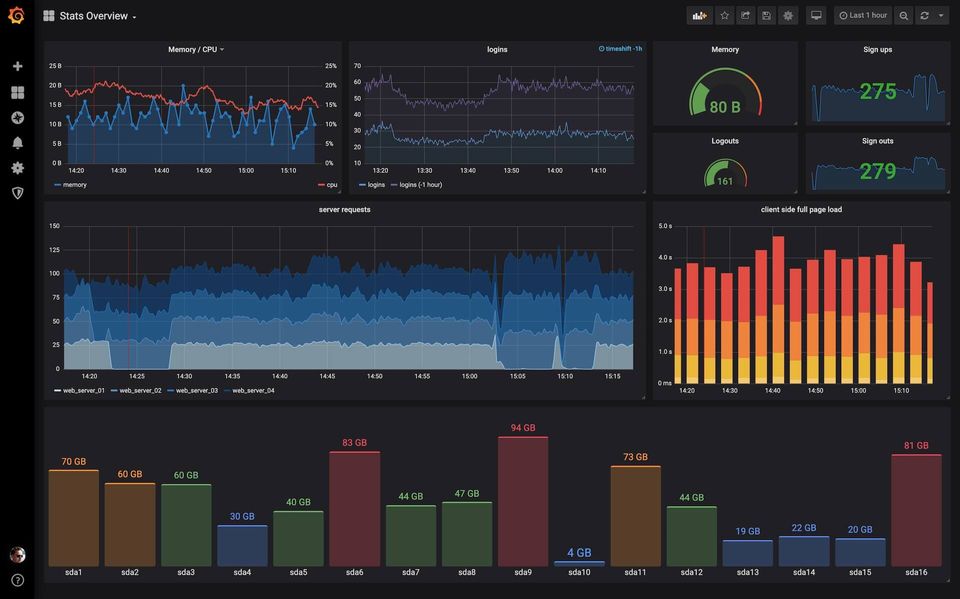 4 Screenshots |
|---|---|---|
Videos |  3 Videos |  1 Videos |
Top Alternatives to PRTG Network Monitor and Grafana in 2026
Alternatives |
|---|
Add another option to compare side by side
Search by product name to compare pricing, fit, and buyer feedback in one view.Compare similar software options
Disclaimer: This research has been collated from a variety of authoritative sources. We welcome your feedback at [email protected].
Frequently asked questions
- Which is better, PRTG Network Monitor or Grafana?
- Grafana edges out the other on user ratings (4.5 vs 4.4). That said, the best pick depends on your use case — use the comparison tables above to evaluate each dimension.
- Do PRTG Network Monitor and Grafana offer a free trial?
- Yes, both PRTG Network Monitor and Grafana offer a free trial.
- What is the starting price of PRTG Network Monitor vs Grafana?
- PRTG Network Monitor starts at Contact for pricing. Grafana starts at $49 /Month.
- What are the top alternatives to PRTG Network Monitor?
- Top alternatives to PRTG Network Monitor include Nagios XI, Zabbix, Nagios Network Analyzer, SolarWinds ipMonitor, Netcrunch.
- What are the top alternatives to Grafana?
- Top alternatives to Grafana include iDashboards, DataHero, Databox, Klipfolio Dashboard, Prometheus.