Grafana vs Whatagraph Comparison
Grafana
Starting at $49 /Month
- Free Trial
- Large Enterprises
- Medium Business
Grafana is a feature-rich metrics dashboard and graph editor. It provides rich visualizations for time series data, including support for granular continuous and discrete triggers such as changes in context, changes in m…
Whatagraph
Starting at $119 /Month
- Free Trial
- Large Enterprises
- Medium Business
Whatagraph is a dashboard solution that seamlessly syncs to an unlimited number of Google Accounts. Share, customize and work with team, any team or even multiple teams in real-time with Whatagraph. Collaborative editing…
Grafana leads on user satisfaction with a 4.5-star rating across 50 reviews.
Spotsaas Analysis
GrafanaWhatagraph
The core difference between Grafana and Whatagraph lies in their primary focus: Grafana excels in providing flexible, real-time monitoring dashboards for IT and DevOps, while Whatagraph is tailored for marketing teams seeking automated reporting solutions. Ideal buyers for Grafana are IT professionals and DevOps teams, whereas Whatagraph is best suited for marketing teams managing Google Analytics.
- Best for real-time monitoring dashboards - Extensive data source integrations - Ideal for IT infrastructure and DevOps - Customizable dashboard options - Seamless integration with Prometheus and Loki - Suitable for medium to large companies
- Best for automated Google Analytics reporting - Focused on marketing team collaboration - Facilitates management of multiple Google Accounts - Saves time through report automation - Enhances real-time collaboration among team members - Ideal for medium to large companies
Grafana vs Whatagraph — at a glance
| Feature | Grafana | Whatagraph |
|---|---|---|
| Rating | 4.5 / 5 | 4.3 / 5 |
| Reviews | 50 | 203 |
| Starting price | $49 /Month | $119 /Month |
| Free trial | Yes | Yes |
| Free version | No | No |
| Best for | Large Enterprises, Medium Business, Small Business | Large Enterprises, Medium Business, Small Business |
| Category | Dashboard Software | Dashboard Software |
| Integrations | 1+ apps | — |
| Platforms | SaaS/Web/Cloud, Installed - Windows, Installed - Mac | SaaS/Web/Cloud |
| API | Available | Available |
| Support modes | Online | Online |
| Certifications | SOC 2, GDPR | GDPR |
| Data residency | Global | US |
Key differences between Grafana and Whatagraph
- Pricing: Grafana starts at $49 /Month, while Whatagraph starts at $119 /Month.
- User satisfaction: Grafana scores higher with a 4.5-star average.
- Deployment: Grafana supports SaaS/Web/Cloud, Installed - Windows, Installed - Mac; Whatagraph supports SaaS/Web/Cloud.
Grafana vs Whatagraph — find the better fit before you commit.
Which tool fits your team best
Which is actually cheaper for your team size
Where each product wins, per real buyers
Most Dashboard Software tools look identical on paper. This comparison cuts to the differences that matter — pricing structure, team fit, and what real buyers found after signing up.
Biggest differences
Features
Pricing
Buying details
Security
Buyer feedback
Integrations
Product tour
Other options
Talk to an expert Talk to an expert |
Free PDF comparison
Download this Grafana vs Whatagraph comparison
Get the full side-by-side as a PDF — these picks plus the top Dashboard Software tools, with verified ratings, pricing and features.
- Side-by-side on pricing, features & ratings
- Plus the category top 10, scored & ranked
- Emailed to you — no on-screen download
No file downloads on screen — we email it to you. One-click unsubscribe anytime.
Biggest differences
Start here before you go deeper into features.
Best for flexible, real-time monitoring dashboards with extensive data source integrations.
- You need customizable dashboards for IT infrastructure or DevOps monitoring.
- Your team requires seamless integration with tools like Prometheus and Loki.
- You want an open-source platform with a rich plugin ecosystem for extensibility.
- You require advanced alerting features for complex scenarios beyond basic triggers.
- You need a quick, out-of-the-box deployment with minimal setup effort.
Best for marketing teams needing automated, collaborative Google Analytics reporting.
- You manage multiple Google Accounts and need seamless real-time collaboration.
- You want to automate report generation to save time and reduce manual effort.
- You prefer intuitive, customizable templates for clear and consistent data presentation.
- You require highly flexible or unique data visualization customization beyond templates.
- You are a small business with a tight budget concerned about pricing barriers.
Grafana: Best for flexible, real-time monitoring dashboards with extensive data source integrations. Whatagraph: Best for marketing teams needing automated, collaborative Google Analytics reporting.
Description | Grafana is a feature-rich metrics dashboard and graph editor. It provides rich visualizations for time series data, including support for granular continuous and discrete triggers such as ... Read More about Grafana | Whatagraph is a dashboard solution that seamlessly syncs to an unlimited number of Google Accounts. Share, customize and work with team, any team or even multiple teams in real-time with ... Read More about Whatagraph |
|---|---|---|
Entry Level Pricing |
|
|
Free Trial Availability |
| |
SpotScoreWhat's this? ↗ | 9.4/10 | 9.3/10 |
User RatingsBased on verified Spotsaas reviews | ||
Best Company Size | 51-500 employees500+ employees | 51-500 employees500+ employees |
Get pricing help | Get pricing help |
Software Demo
Demo |
|---|
Need a second opinion?
Get shortlist help from a software advisor
Share your priorities, budget, and team needs, and we’ll help you narrow the options and understand the tradeoffs before you talk to vendors.

- Independent advice — matched to your business
- Understand the tradeoffs before you talk to vendors
- Free 15-min call with a software advisor.
Step 1 of 4
How big is your team?
We tailor recommendations to companies your size.


How do Grafana and Whatagraph Compare on Features?
Total Features | 18 Features | 8 Features |
|---|---|---|
Unique Features | No unique features | No unique features |
Get Quote | Get Quote |
Compare Grafana and Whatagraph on pricing
Review starting price, plan structure, and free-trial access side by side so you can see which option fits your budget and buying process.
Pricing Option | ||
|---|---|---|
Starting From |
|
|
Pricing Plans |
|
|
Pricing Page | 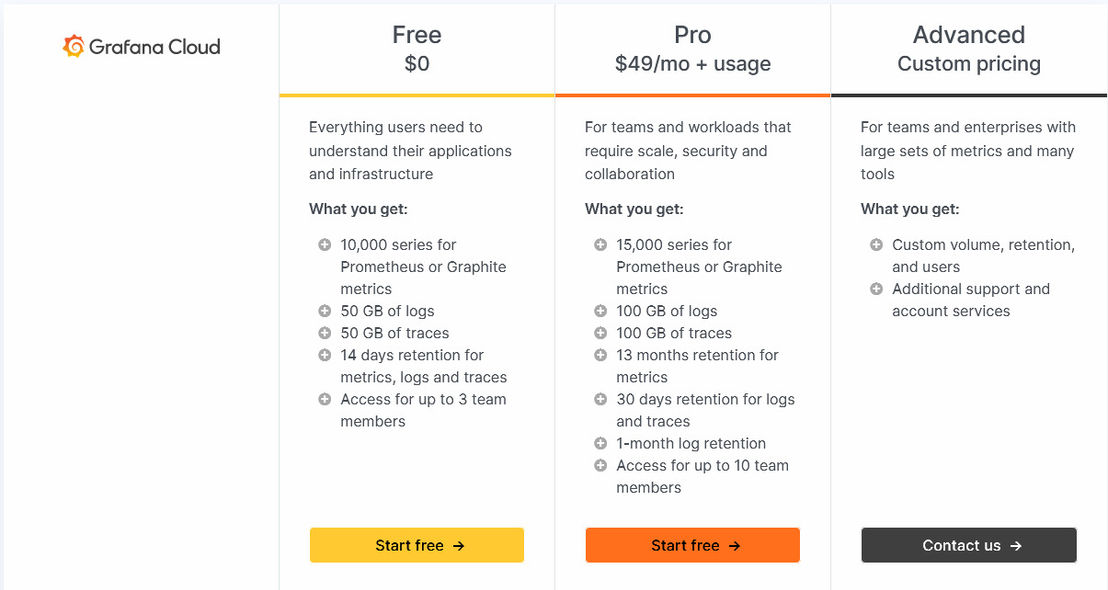 |  |
Other Details
Organization Types supported |
|
|
|---|---|---|
Platforms Supported |
|
|
Modes of support |
|
|
API Support |
|
|
Get help choosing | Get help choosing |
Security & Compliance
Certifications, data handling, and security controls for IT and compliance evaluators.
SOC 2 | ✓ Yes | — |
|---|---|---|
HIPAA | — | ✗ No |
GDPR | ✓ Yes | ✓ Yes |
Single Sign-On (SSO) | ✓ Yes | ✓ Yes |
Multi-Factor Auth (MFA) | ✓ Yes | — |
Data Encryption | ✓ Yes | ✓ Yes |
Audit Logs | ✓ Yes | — |
Data Residency | 🌐 Global | 🇺🇸 US |
Grafana User Reviews & Rating Comparison
User Ratings | ||
|---|---|---|
Rating Distribution | ||
Spotsaas Editor’s POV generated by AI | Buyer sentiment Overall positive sentiment highlights Grafana's flexibility, user-friendly dashboards, and strong integration capabilities, tempered by some concerns about alerting limitations and setup complexity. What buyers like
Common complaints
| Buyer sentiment Overall positive sentiment highlighting ease of use, automation, and customer support with some concerns about pricing and integration stability. What buyers like
Common complaints
|
Pros and Cons |
|
|
Positive Reviews | No reviews available for the product | No reviews available for the product |
Integrations
Integration with other apps | No Integration information available. |
|---|
List of Customers
Customers |  Roblox  asos Sky Italia | No Customers information available. |
|---|
Media and Screenshots
Screenshots | 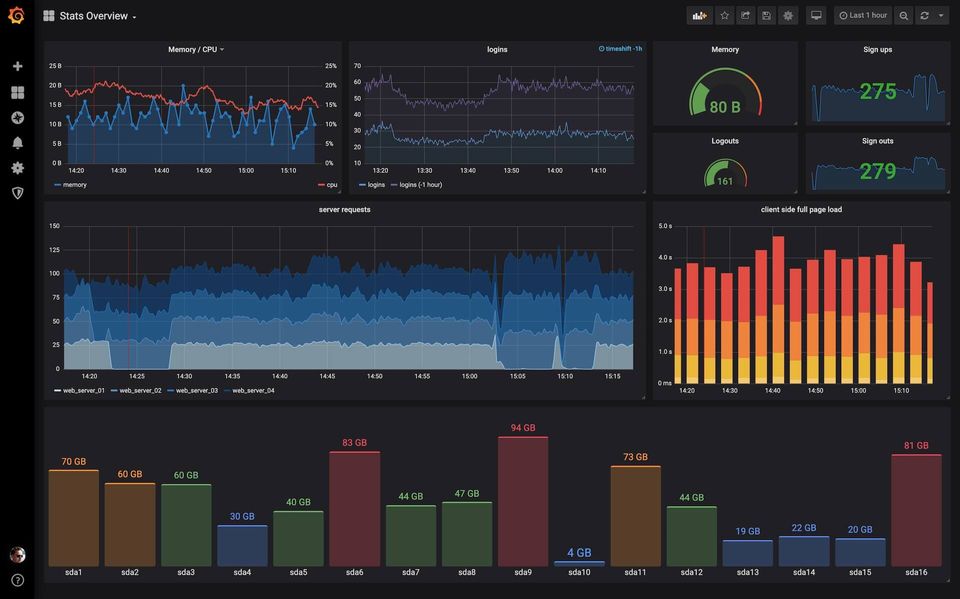 4 Screenshots |  3 Screenshots |
|---|---|---|
Videos |  1 Videos |  3 Videos |
Top Alternatives to Grafana and Whatagraph in 2026
Alternatives |
|---|
Add another option to compare side by side
Search by product name to compare pricing, fit, and buyer feedback in one view.Compare similar software options
Disclaimer: This research has been collated from a variety of authoritative sources. We welcome your feedback at [email protected].
Frequently asked questions
- Which is better, Grafana or Whatagraph?
- Grafana edges out the other on user ratings (4.5 vs 4.3). That said, the best pick depends on your use case — use the comparison tables above to evaluate each dimension.
- Do Grafana and Whatagraph offer a free trial?
- Yes, both Grafana and Whatagraph offer a free trial.
- What is the starting price of Grafana vs Whatagraph?
- Grafana starts at $49 /Month. Whatagraph starts at $119 /Month.
- What are the top alternatives to Grafana?
- Top alternatives to Grafana include iDashboards, DataHero, Databox, Klipfolio Dashboard, Prometheus.
- What are the top alternatives to Whatagraph?
- Top alternatives to Whatagraph include AgencyAnalytics, Reportz, iDashboards, DashThis, myDATA3.